Simultaneity Calculation (dialog)
The Simultaneity Calculation dialog: maximum time shift, time step, accuracy, editing the target simultaneity curve, plus chart and consumer time shifts.
Overview
The Simultaneity Calculation dialog bundles the settings, calculation and results of simultaneity. It is opened via the  Calculation options… button in the Simultaneity and Part Load tab (with simultaneity activated). The dialog works on a copy of the project; only Apply to project transfers the results.
When the dialog is opened, previously saved results are discarded - the calculation must therefore be started again with Calculate each time it is opened.
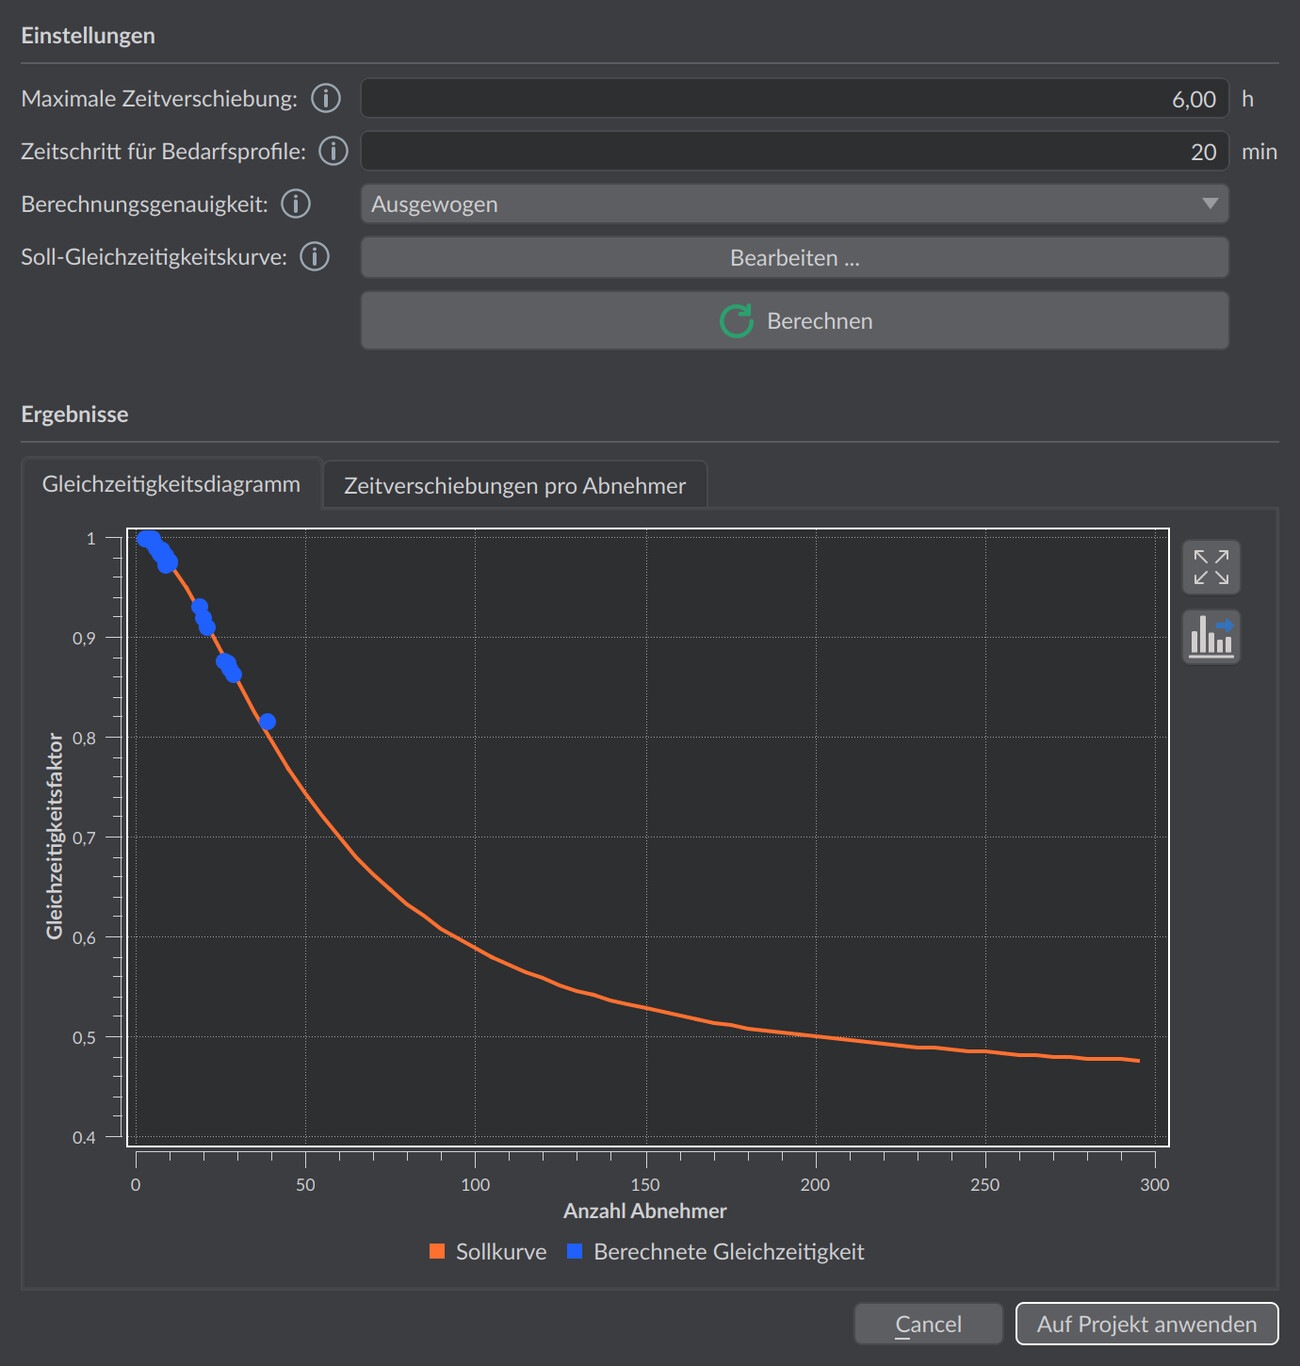
Settings
| Option | Default | Range | Meaning |
|---|---|---|---|
| Maximum time shift: | 6.00 h | 0 - 24 h | Maximum shift of each demand profile forward or backward. Larger values offer more scope for peak-load reduction but become less realistic; typical values are 3 - 6 h. Values above 10 h are possible, but their physical significance then decreases. A value of 0 deactivates the shift |
| Time step for demand profiles: | 20 min | > 1 - 1440 min | Temporal resolution with which the profiles are discretized. Smaller values are more accurate but slow down the calculation; the value must be an integer > 1 and must divide 1440 (= minutes per day) without a remainder (e.g. 10, 15, 20, 30, 60). Typical: 15 - 30 min |
| Calculation accuracy: | Balanced | Fast / Balanced / Thorough | Trade-off between speed and result quality. Fast uses fewer optimization runs, Thorough considerably more, which can improve the results for large networks. Balanced is recommended for most cases |
| Target simultaneity curve: | Winter et al. | – | Via the Edit … button the target curve is inspected and changed in the Edit simultaneity dialog (see below) |
If one of these settings is changed while results already exist, the query Discard simultaneity results? appears. With Yes the results are discarded, with Cancel the input is reset.
Practical tip
The Maximum time shift is the most effective lever on the result - and at the same time the most easily overdone. Larger values spread the peaks out more strongly and lower the simultaneity, but assume that demands can really be shifted by several hours. Stay in the plausible range of 3-6 h; values above 10 h yield nicer factors but lose their physical significance. For the Calculation accuracy, Balanced is the right choice in most networks.
Running the calculation
The  Calculate button starts the optimization. A progress bar appears, the calculation can be stopped with Cancel. If the time step is not a divisor of 1440, the dialog reports Invalid time step and aborts.
After a successful calculation the dialog reports Optimization complete with the number of calculated consumers and - provided routes were evaluated - the mean deviation from the target value.
Results
The results appear in two tabs that are only active once valid results exist:
- Simultaneity chart - shows the target curve and the calculated simultaneity per route over the number of consumers. Only routes with at least three downstream consumers are shown as points.
- Time shifts per consumer - table with the columns Consumer and Time shift [h].
Applying the results
The Apply to project button transfers the settings and results into the project; it is only operable with valid results. Cancel discards all changes in the dialog. Changes to the network, demand or target curve invalidate stored results - they must then be recalculated before being applied.
Editing the target simultaneity curve
The Edit … button next to Target simultaneity curve: opens the Edit simultaneity dialog. It shows the target curve on the left as a chart and in the center as a lookup table with the columns Number of buildings [-] and Simultaneity [-].
| Element | Meaning |
|---|---|
| Lookup table | Each row is a curve point and can be edited directly. The Number of buildings must be an integer > 0 and must run in ascending order; the Simultaneity must lie in the range > 0 and ≤ 1 |
| Set default function | After a query, resets the curve to the default function according to Winter et al. (Euroheat & Power, 2001); support points up to 295 buildings |
To the right of the table there are four icon buttons: add a curve point (5 buildings further, 90 % of the last simultaneity value), remove selected points (the curve always keeps at least two points), copy all points tab-separated to the clipboard, and paste two-column data from the clipboard (after a query).
With OK the changed curve is adopted, with Cancel it is discarded. For individual pipes the curve can additionally be overridden by a custom simultaneity.