Weather & Climate Data for Building Simulation
Download. Visualize. Export as EPW & C6B.
With VICUS CLIMATE you download DWD weather data, test reference years (TRY 2015/2045) and worldwide climate datasets, visualize them interactively and export as EPW, C6B or TSV for VICUS, EnergyPlus, DELPHIN and other simulation tools.

Why VICUS CLIMATE?
All the climate data you need – in a web app, right in your browser. Analysis is free and needs no account; only exporting requires a sign-in.
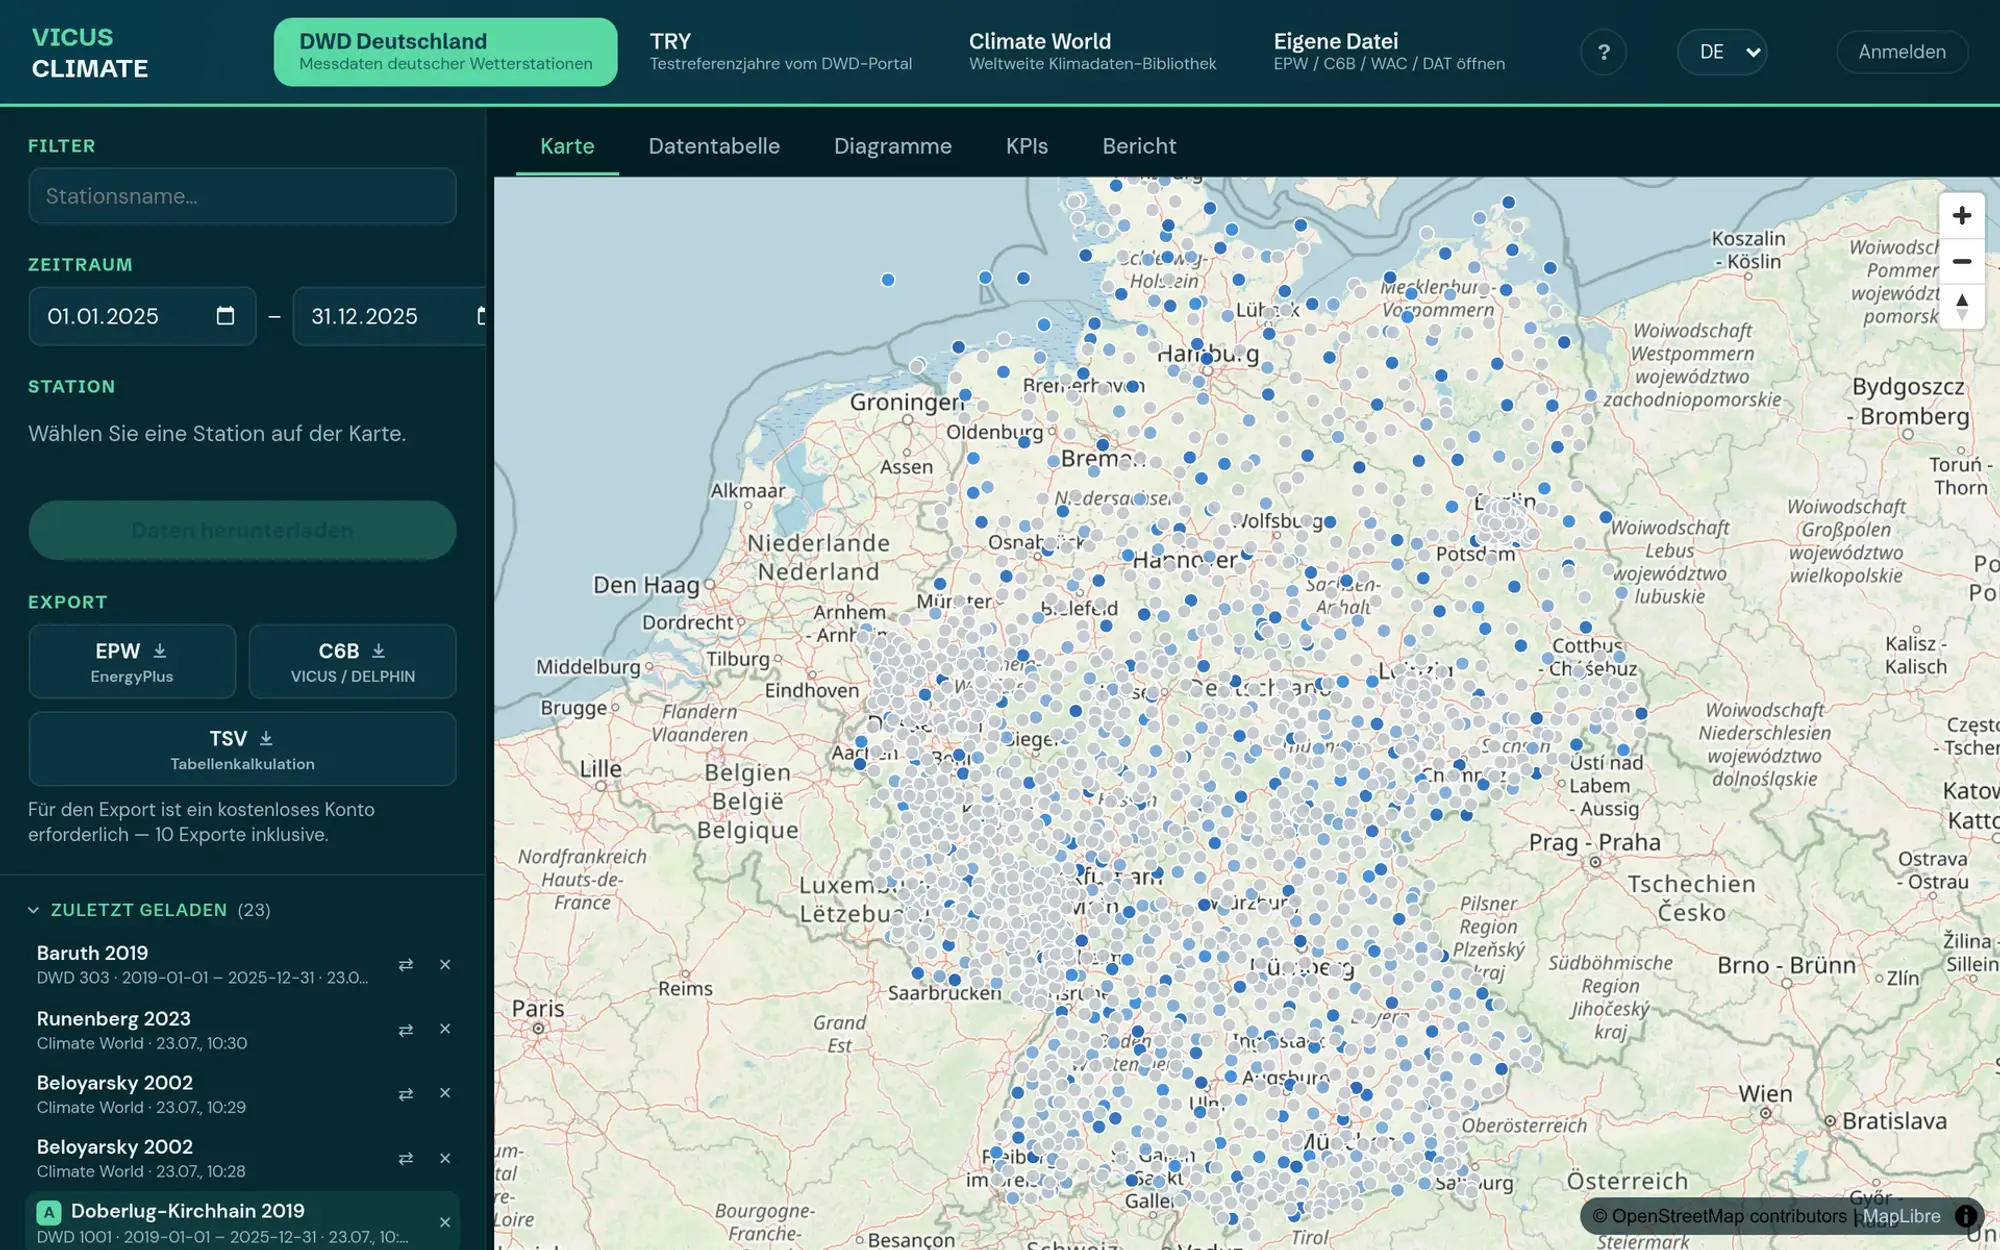
DWD measurements
Hourly measurements from about 2,200 German Weather Service stations: temperature, radiation, wind, precipitation and more.
Test reference years (TRY)
TRY 2015 and 2045 in the normal, extreme-summer and extreme-winter variants – for any coordinate in Germany.
Worldwide climate data
About 98,000 locations worldwide (EPW/TMYx) with an interactive map. Or open your own EPW, C6B, WAC or DAT files.
Edit & export
Interactive charts, an editable data table and export as EPW, C6B or TSV – for VICUS and all common simulation tools.
Four data sources, one tool
DWD Germany
Hourly measurements from about 2,200 DWD stations. Pick a station on the map, choose the period, download. Missing quantities (e.g. radiation) can be composed from nearby stations within 40 km.
Test reference years (TRY)
TRY 2015 (current) and TRY 2045 (future projection) in the normal, extreme-summer and extreme-winter variants – for any coordinate in Germany (requires DWD portal credentials).
Climate World
A worldwide library of about 98,000 locations (EPW/TMYx), selectable interactively on the map. If a location offers several datasets, a picker appears.
Custom files
Open existing climate files – EPW, C6B, WAC or DAT (max. 20 MB). Metadata such as city, coordinates, elevation and time zone stays editable.
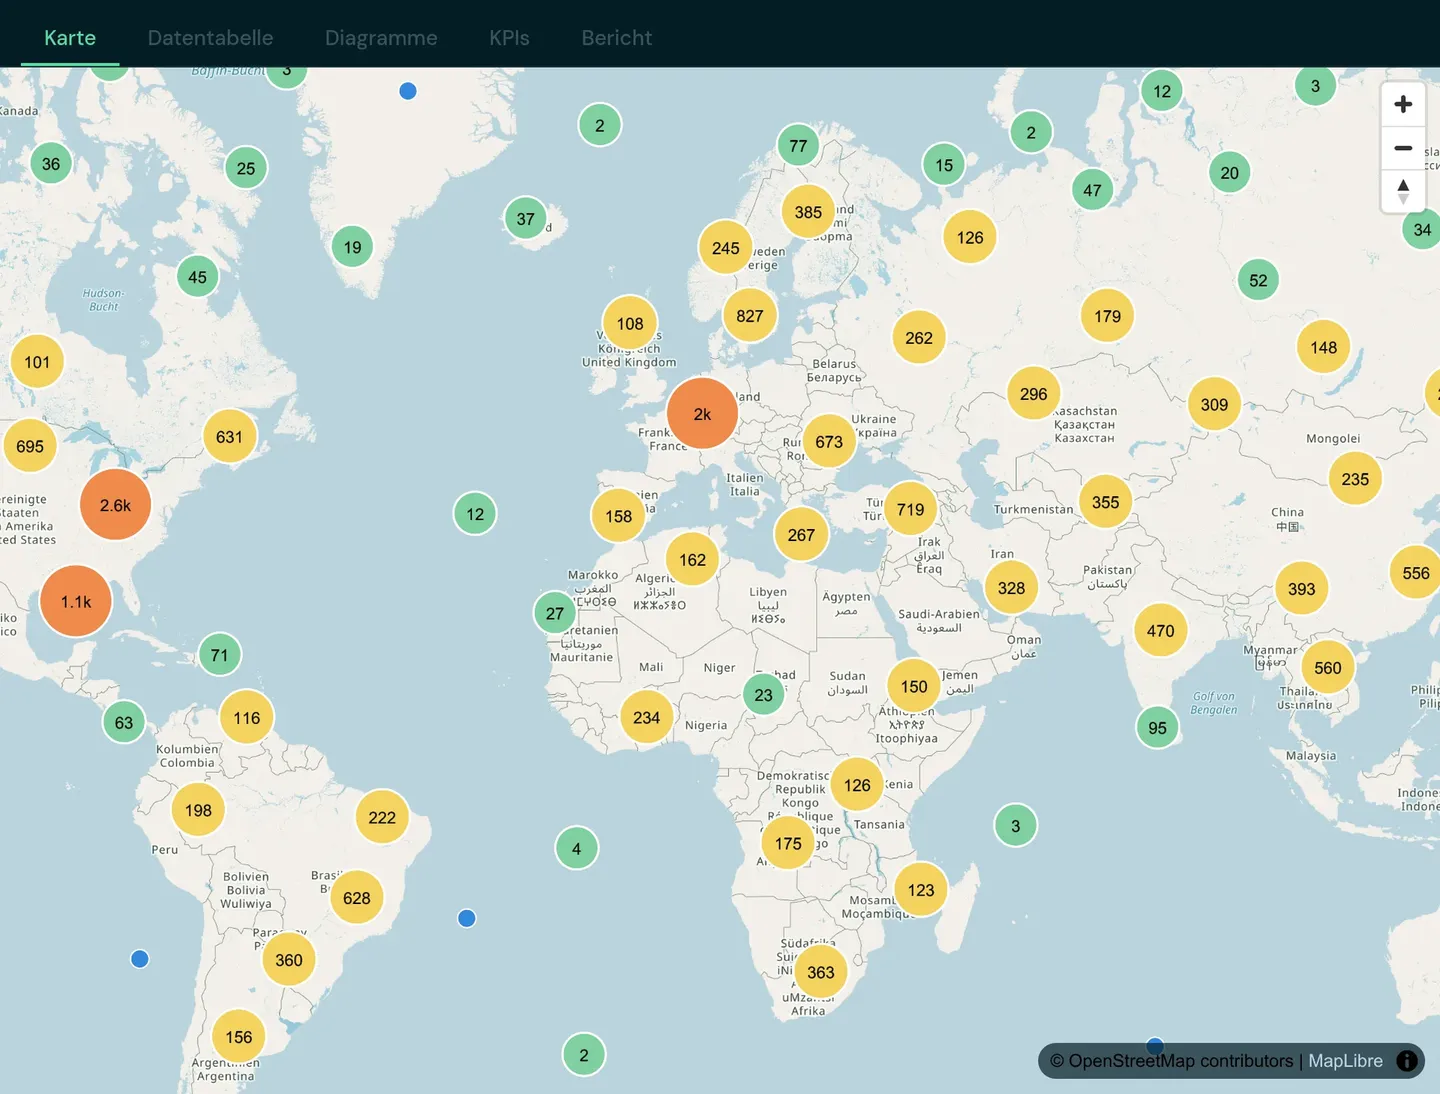
One workspace, five views
Map, data table, plots, KPIs and report – switchable with keys 1–5, all on the same loaded dataset.
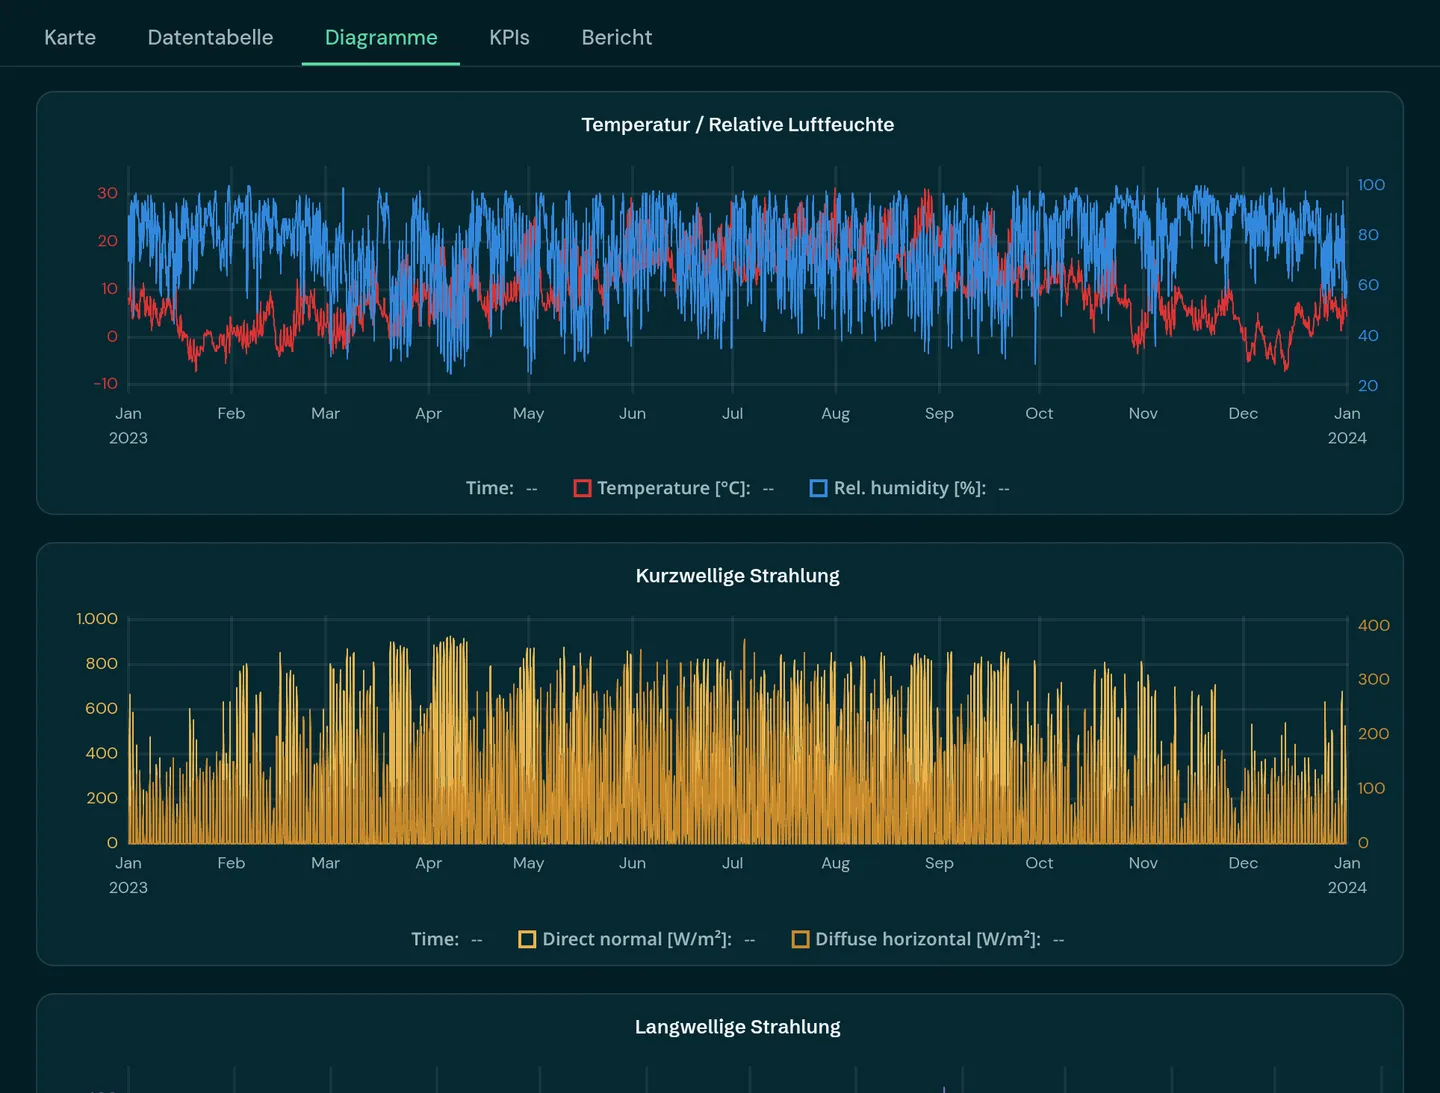
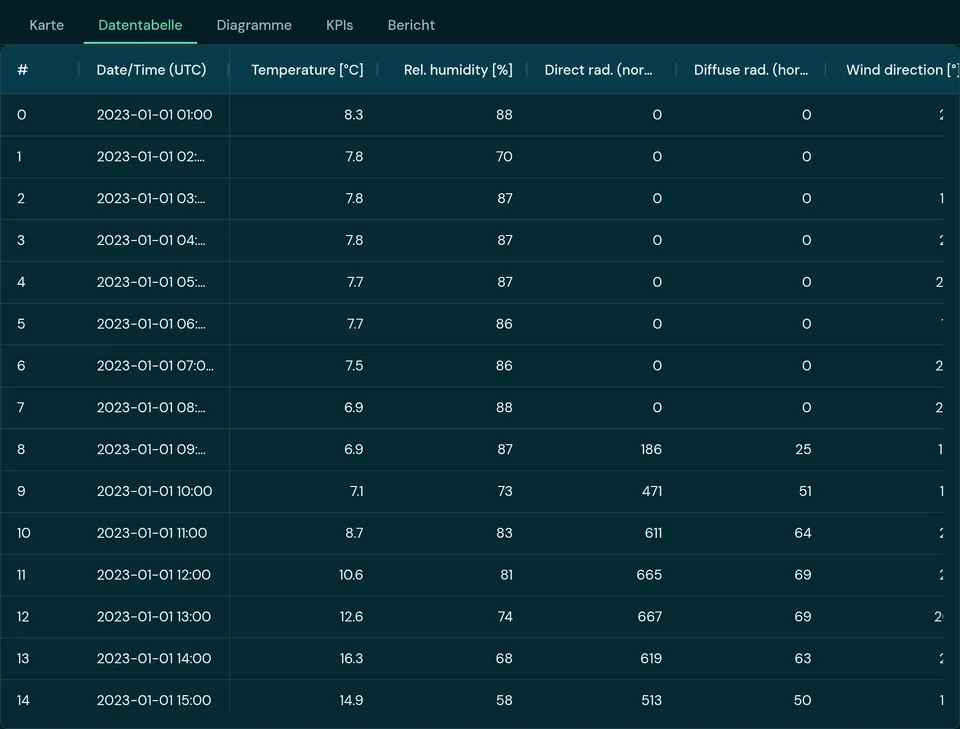
Plots & data table
Five synchronized annual charts at hourly resolution – drag to zoom, all plots stay in sync. In the data table every hourly value is editable; edits flow straight into your exports.
Metrics, degree days & A/B comparison
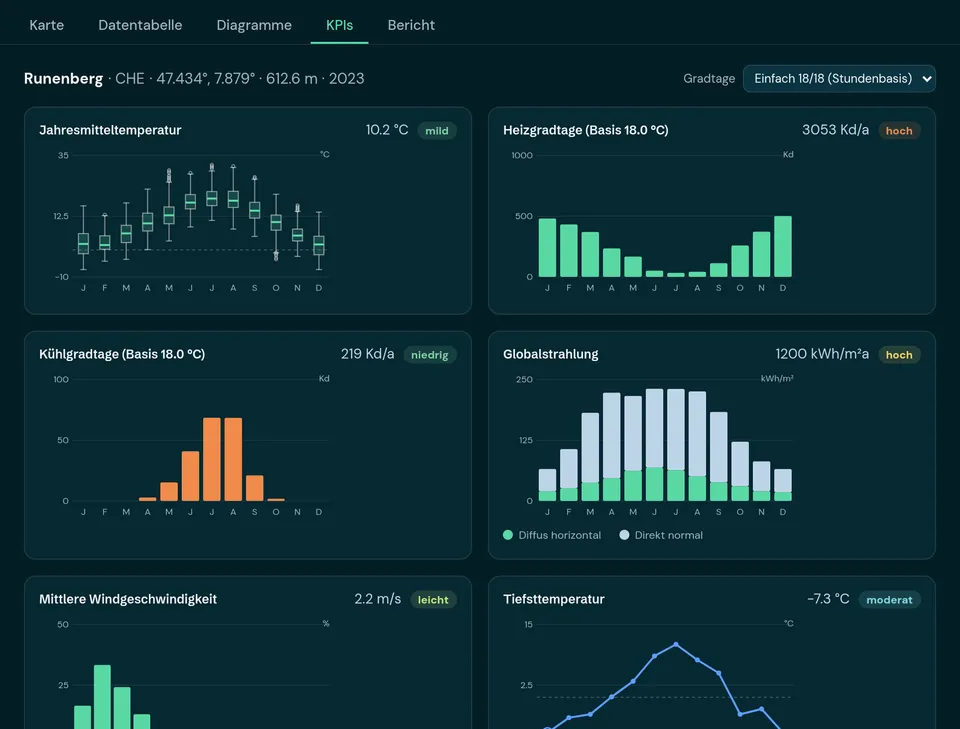
KPI cards with an assessment and monthly charts summarize the location. Heating and cooling degree days (HDD/CDD) are freely configurable, following the common conventions:
- Simple 18/18 (hourly) – the default, with a "low/moderate/high" rating
- GTZ 20/15 (DIN 4108-6 / VDI 2067)
- HGT 15 (VDI 3807)
- Eurostat 18/15 · 21/24 and ASHRAE 18.3
- or free custom base temperatures
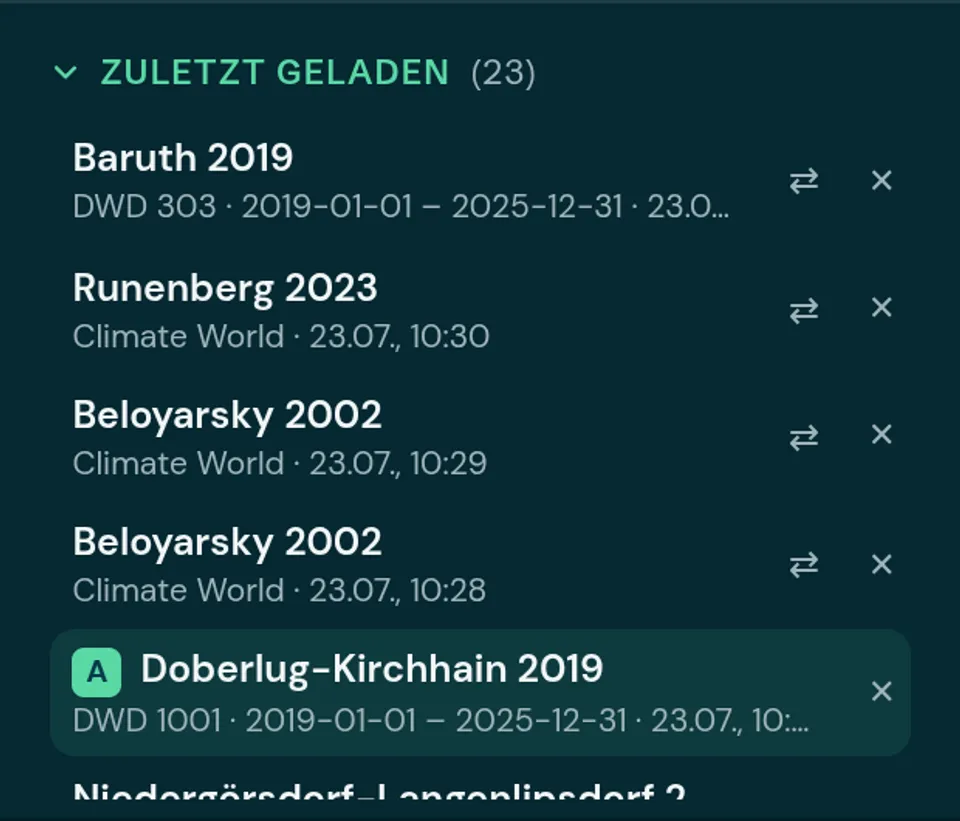
The ⇄ icon overlays a second dataset as comparison (B) on the active data (A): KPI charts draw B as a dashed line and every metric shows the B value with its delta (Δ). Compare locations, years, or measurements against TRY data.
Report & export – for VICUS
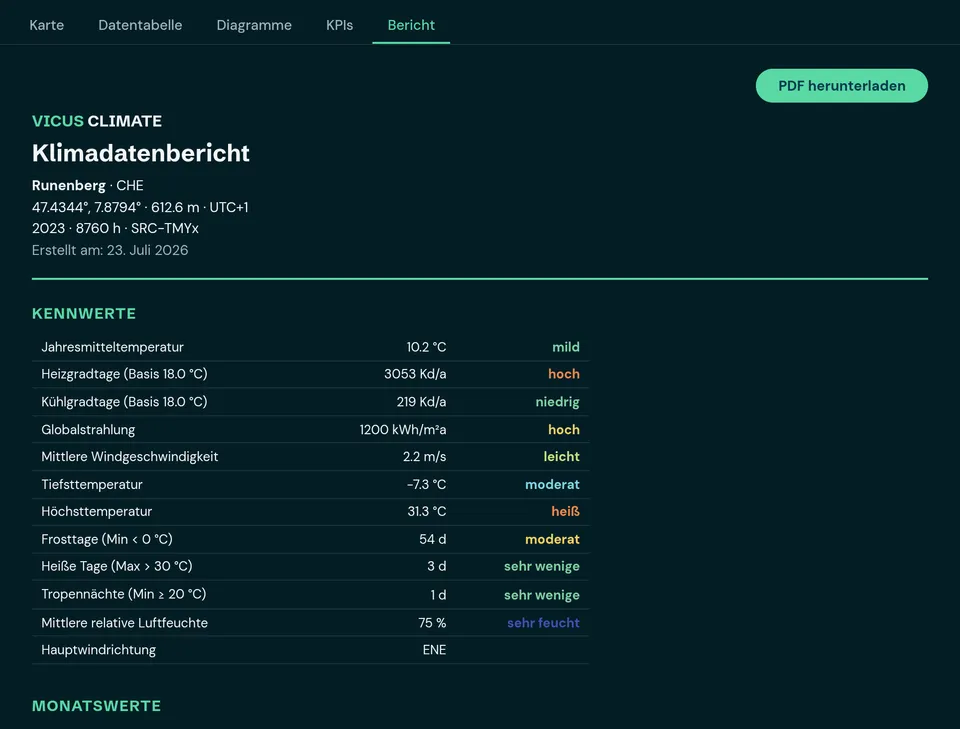
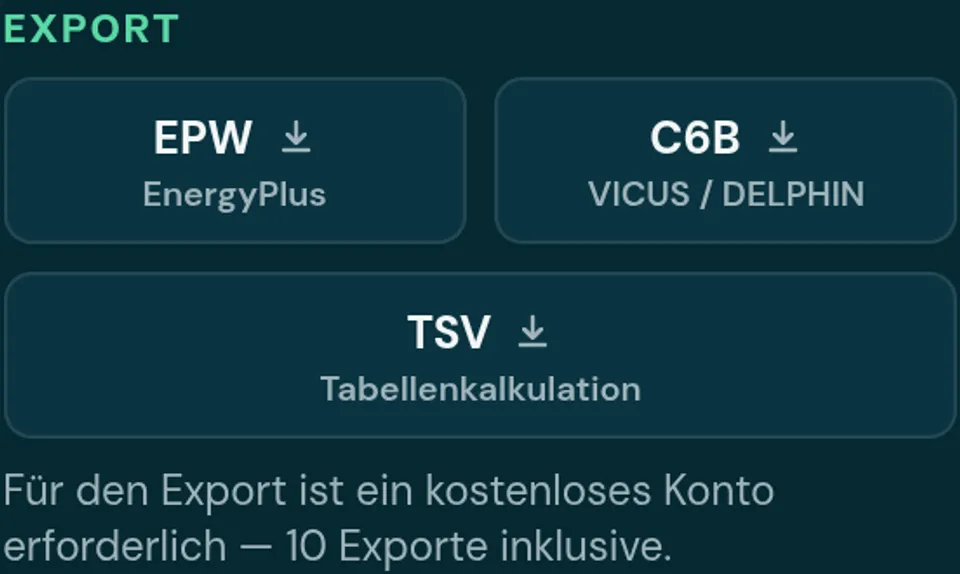
The report bundles metrics, the monthly table and annual charts into a designed PDF. Export runs in three formats:
- EPW – EnergyPlus weather file, the most common exchange format (max. one year)
- C6B – binary format for VICUS and DELPHIN
- TSV – tabular format for spreadsheets and custom evaluations
Exports run through the engine's original writers and are byte-identical to the desktop application; edits from the data table are included.
After loading, the sidebar shows per-quantity completeness with traffic-light colors. For multi-year ranges, summed quantities are normalized per year – the "Year" column reads as an average year.
Analyze for free – Pro for power users
VICUS CLIMATE runs as a web app right in your browser – no installation. All analysis features are freely accessible; only exporting climate files requires an account.
Free
Analyze without an account, export with a free account.
- Maps, charts, KPIs and reports without an account
- A/B comparison and PDF climate report
- Editable data table
- 10 climate-file exports included (EPW, C6B, TSV)
Pro
For planning offices with ongoing projects.
- All Free features
- Unlimited climate-file exports
- Convenient payment via PayPal
Data protection (GDPR): Analysis works without signing up – no personal data is collected in the process. An account only requires your e-mail address. The web application uses no tracking or advertising cookies. For details, see our privacy policy.
All analysis features are free and need no sign-up, right in your browser – only exporting requires an account.