Consumers and connection load
Consumer properties on the Building demand tab: color modes, demand sums, connection load and heat pump with COP in 5GDHC networks
Overview
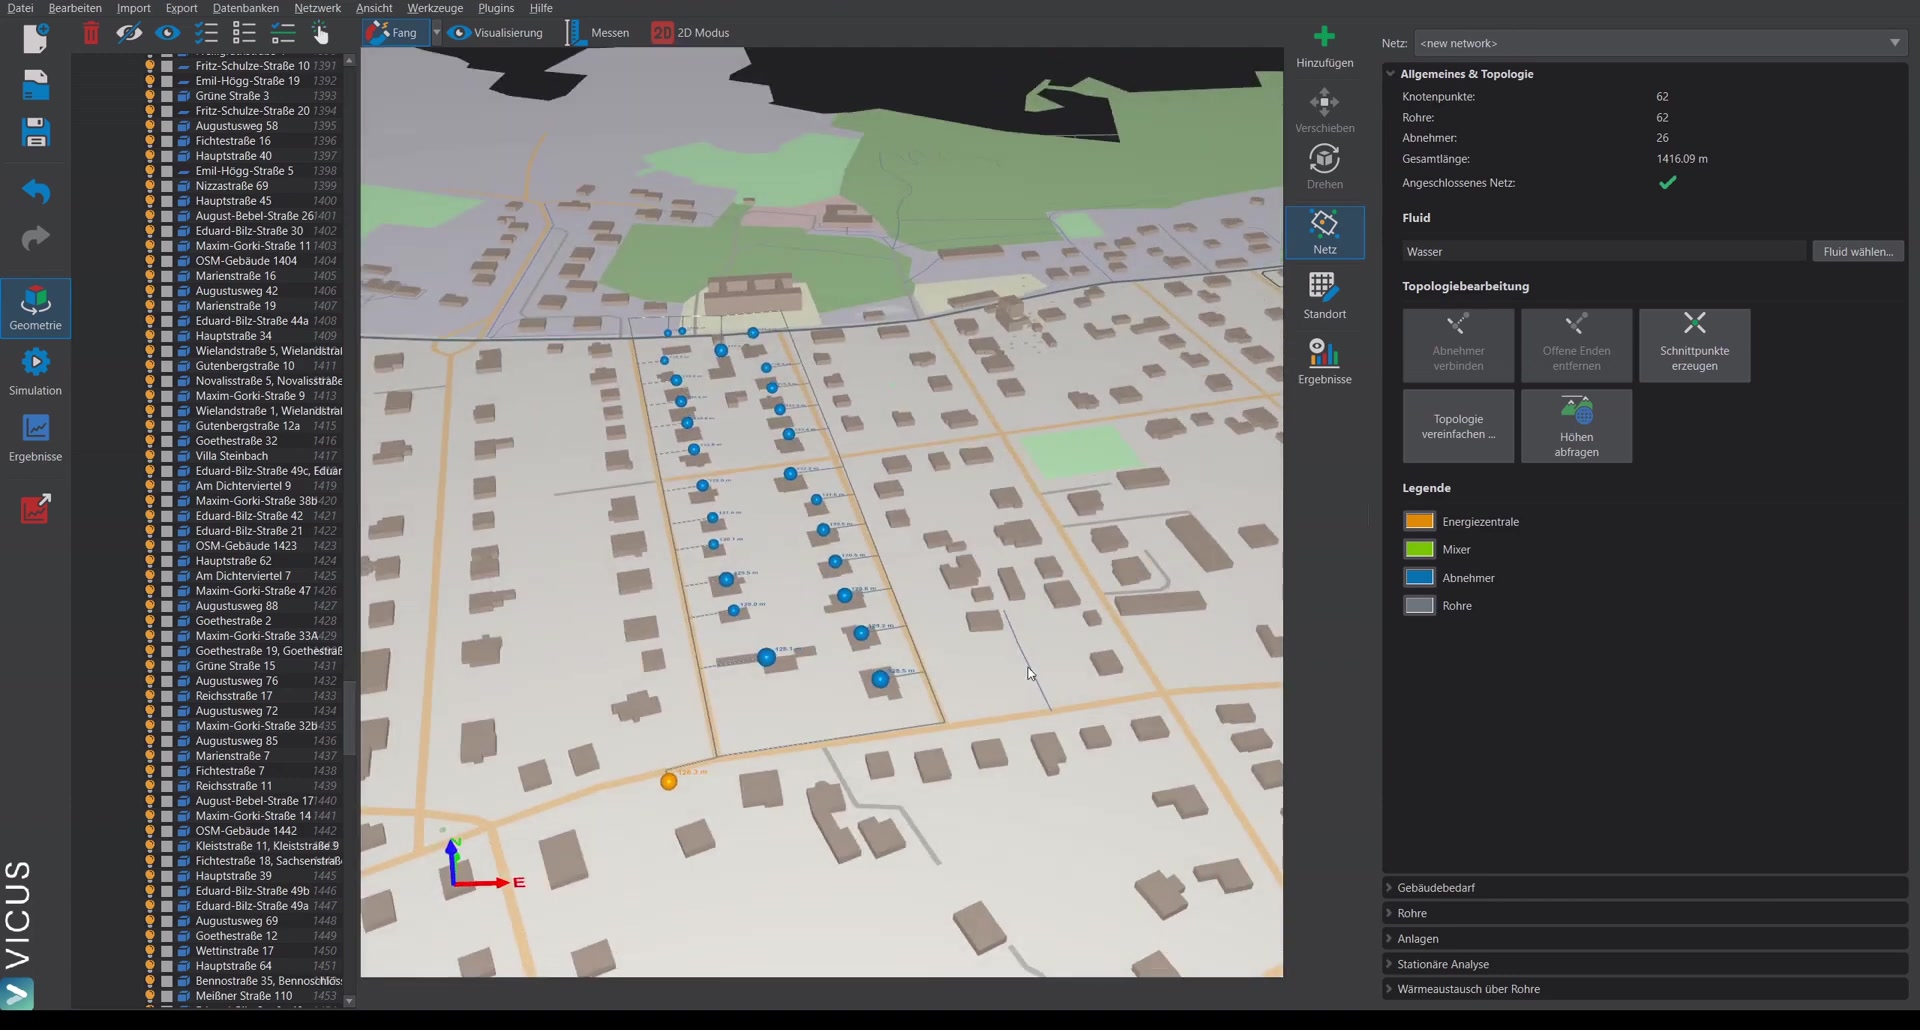
Consumers are the demand nodes of the network – the connection points at which a building draws heat (and, in 5GDHC networks, also cold) from the network. Each consumer carries a connection load and a demand model that describes the time course of heating, cooling and domestic hot water demand. The Building demand tab in the network properties displays these characteristic quantities as false color in the network, shows power and demand sums across all consumers, and is used to edit the connection load; in 5GDHC networks it additionally handles the heat pump coupling with COP.
How to open
The  Network button in the toolbar of the 3D view opens the network properties (available as soon as the project contains a network, see User interface and navigation). There, select the Building demand tab. The content depends on the selection:
- No consumers selected: summary display across all consumers of the active network
- One or more consumer nodes selected: properties of the selected consumers
Color mode
The Color mode: selection field determines which characteristic quantity of the consumers is displayed in color in the network. Numeric quantities are mapped onto a continuous color scale with legend, categorical quantities receive their own color per category.
| Entry | Display |
|---|---|
| Connection load [kW] | numeric (default) |
| Heating power [kW] | numeric |
| Heating energy demand [MWh] | numeric |
| Cooling power [kW] | numeric |
| Cooling energy demand [MWh] | numeric |
| Energy demand for hot water [kWh] | numeric |
| Hot water supply temperature [C] | numeric |
| Floor area [m²] | numeric |
| Demand model | categorical, one color per model type |
| Building type | categorical, one color per building type |
| Heating curve | categorical, one color per assigned heating curve |
| COP [-] | numeric, available only in 5GDHC networks |
Summary display
Without a selection, the tab shows the sums across all consumers of the active network:
| Indicator | Unit | Content |
|---|---|---|
| Total connection load: | kW | Sum of the connection loads of all consumers |
| Summed heating load: | kW | Sum of the maximum heating powers from the demand models |
| Summed heat demand: | MWh | Sum of the annual heating energy demands including domestic hot water |
| Summed cooling demand: | MWh | Sum of the annual cooling energy demands; only visible if greater than 0 |
If consumers use custom time series from files, the characteristic values are read from the TSV files when opening (progress indicator Reading time series from files).
Below are two buttons:
 Building demand table … opens the table editor for editing, importing and exporting all building demands, see Editing building demands
 Smart Select … opens the Smart Select dialog for filtering and selecting network nodes
Smart Select
The Smart Select dialog selects network nodes by criteria: network, object type, name filter, ID filter, as well as freely combinable property filters with the columns Property, Operator, Value and Unit. This allows, for example, all consumers above a certain heating power to be selected and then edited together.
Connection load
For selected consumer nodes, the Connection load: field in kW appears. The connection load is the installed power at the connection point of the consumer. Together with the nominal temperature difference, it is needed for sizing automatically dimensioned heat exchangers, transfer stations and heat pumps; optionally it also serves as the sizing power for pipe sizing and the steady-state calculation. In conventional networks, with an exactly sized transfer station, it corresponds to the peak value of the demand time series; with a subsequently changed building stock (e.g. renovation) it may lie above it.
The  button next to the field recalculates the connection load of the selected consumers from the peak value of their building demand (including domestic hot water).
Practical tip
The connection load is the key parameter for network sizing - check it before every dimensioning run. If it deviates from the actual peak value because of subsequent demand changes, you will unknowingly size to an outdated value. With the button next to the field, you set it to the current peak value of the building demand for the selected consumers - in a single step for a multiple selection.
For a multiple selection with differing values, the field shows ”-”; an entry is applied to all selected consumers.
Heat pump and COP (5GDHC networks only)
In networks of the 5GDHC type (sub-network with cold district heating), the Connected via heat pump check box and the COP field are additionally available. If the option is enabled, a heat pump is assumed between network and building and the connection load is calculated automatically from the maximum heating power:
| Property | Unit | Range | Meaning |
|---|---|---|---|
| Connected via heat pump | – | on/off | Heat pump between network and building; enable for cold or low-temperature networks in which the building heat pump raises the supply temperature locally |
| COP | – | 1.0–20.0 | Coefficient of performance under nominal conditions; used exclusively to calculate the connection load for pipe sizing and does not affect the dynamic simulation |
With an active heat pump, the Connection load: field is locked, since the value is calculated automatically. The COP [-] color mode displays the entered coefficients of performance in the network.
Notes
- If the heating load of a consumer is changed in the demand model, VICUS Districts asks whether the connection load should be adjusted as well (Also adjust connection load or Keep original connection load).
- The summary display always uses the actual demand values of the models; for time series from files, the first read-in can take a moment with many consumers.