Worst-point control
District heating network, part 7: configure worst-point control for optimal pump regulation
Overview
This part demonstrates how to install a more efficient pump control. In the previous parts, a pump with a constant pressure increase was used. Here, a controlled pump is used instead, which regulates on a worst point.
Installing a controlled pump
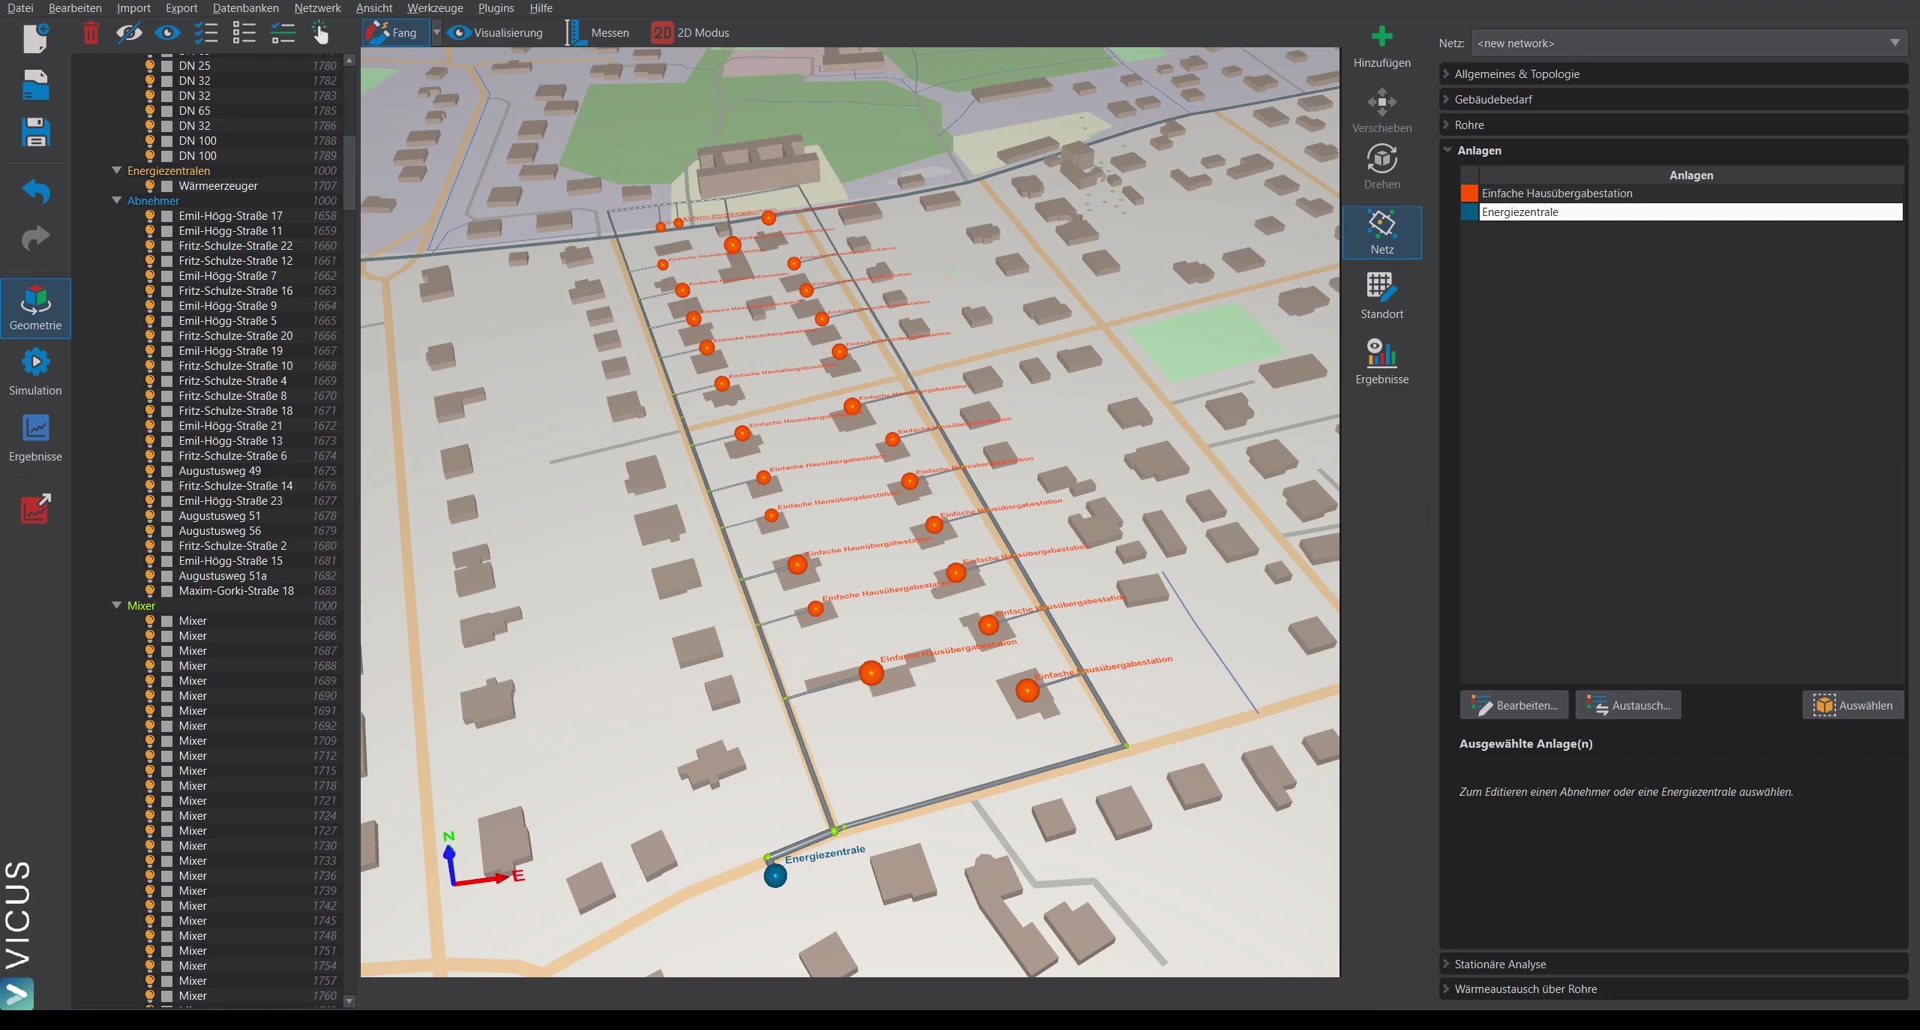
- Open the energy plant and remove the current pump (with constant head, delta-p-c).
- Insert a pump with controlled head and reconnect it.
Controller settings
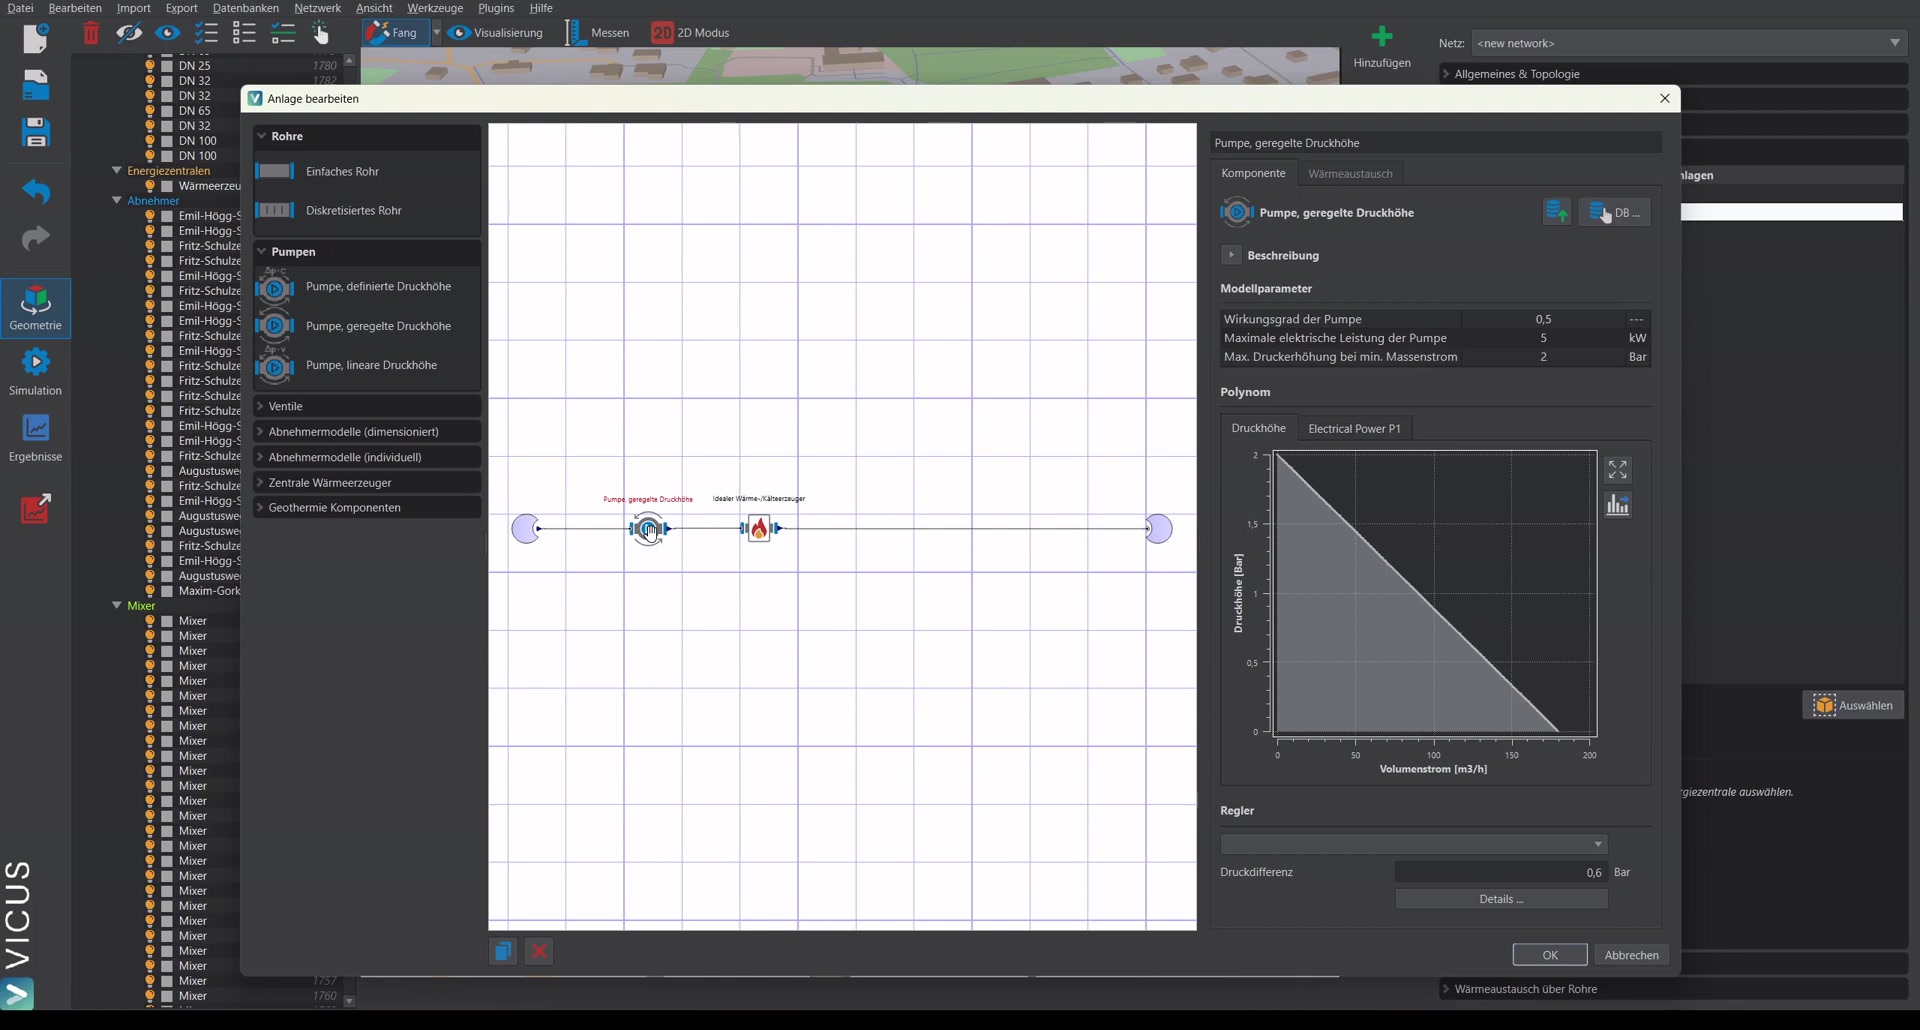
In the settings of the controlled pump:
- Select worst-point control as the controller.
- Set the pressure difference that is to be maintained at the worst point slightly higher than the maximum pressure loss of the transfer stations. With a maximum transfer-station pressure loss of 0.5 bar, 0.6 bar is chosen, for example, to always guarantee a positive pressure difference across every transfer station.
- Under Worst point, select the points to be considered. In the simplest case: all points in the network — the simulation then automatically determines the point with the lowest pressure difference at every time step.
Important: A worst point must always be selected, otherwise the system is flagged as invalid.
Steady-state calculation and pump sizing
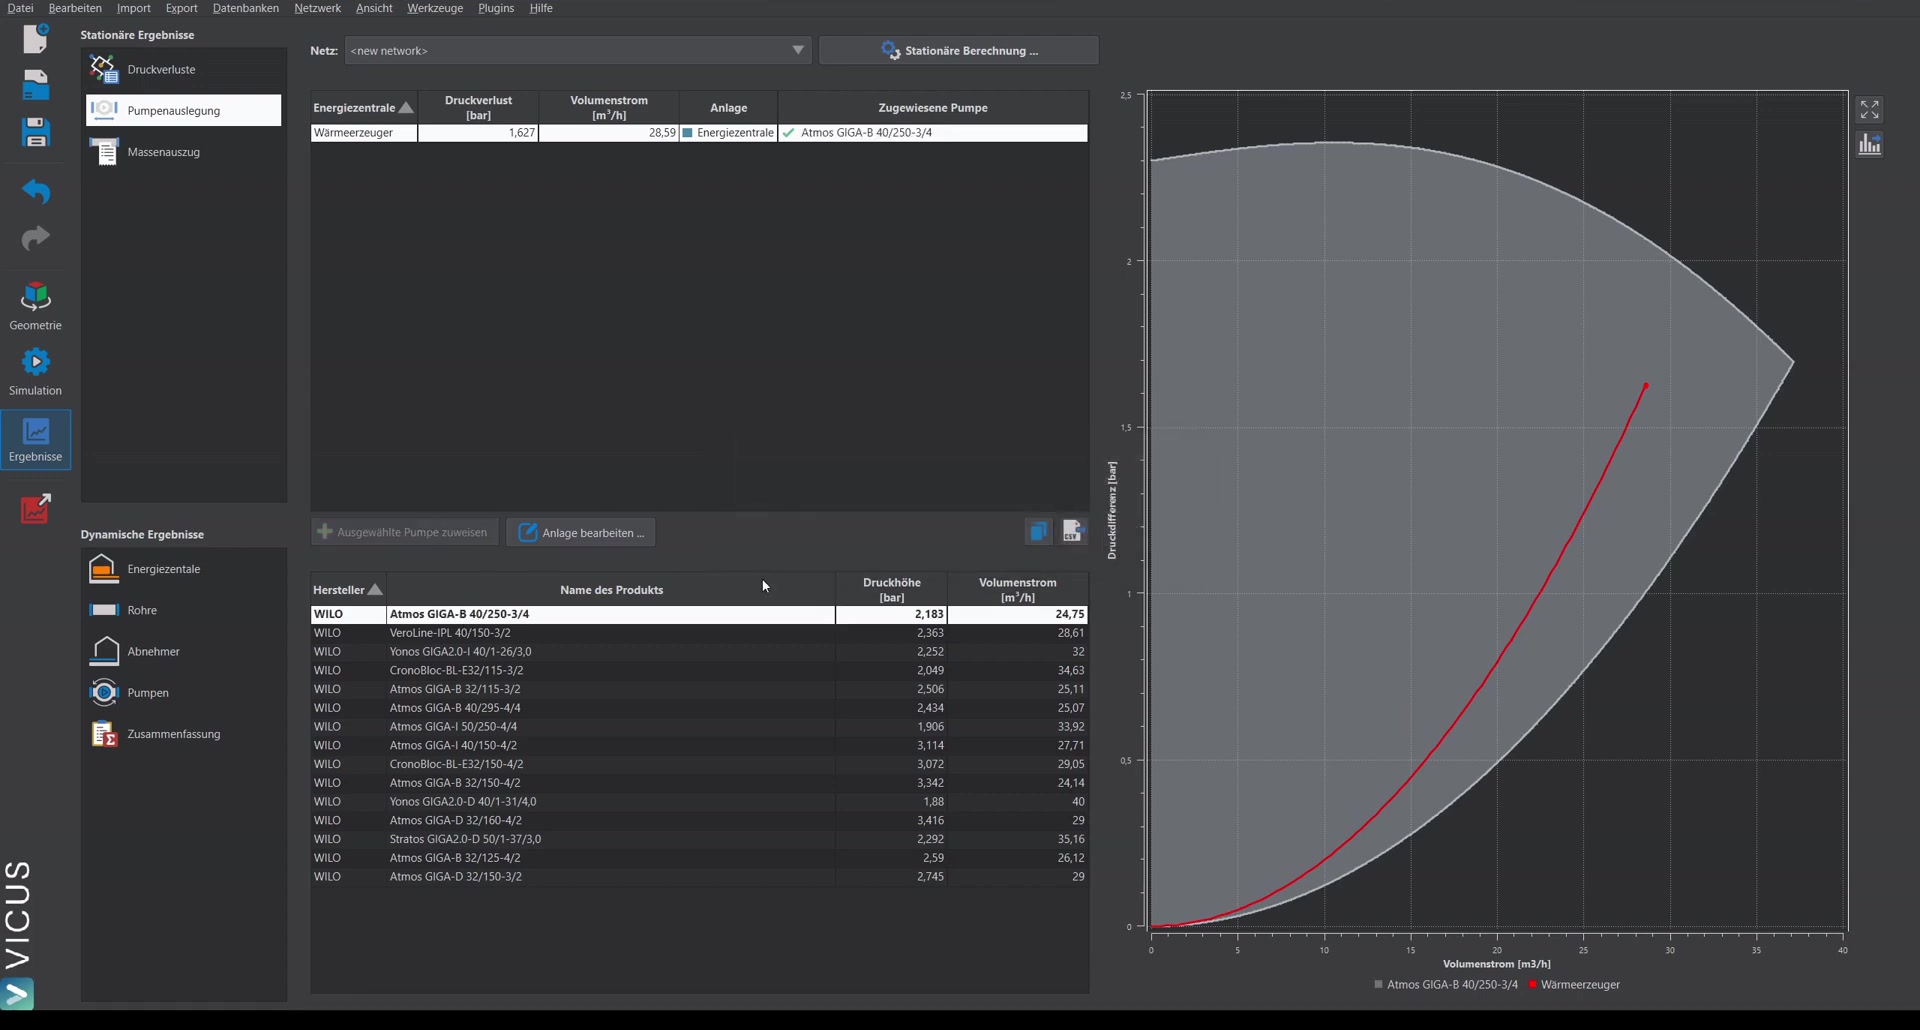
- Calculate the network in steady state — the pressure loss (e.g. 1.6 bar at a 15 Kelvin spread) has not changed.
- Under Results > Pump sizing, re-size the pump. Since a controlled pump is now installed, a matching manufacturer data set must be assigned.
- Select a suitable pump from the list and assign it.
Setting the worst point from steady-state results
As an alternative to the automatic worst point, a specific worst point can also be set from the steady-state results.
Simulation and results
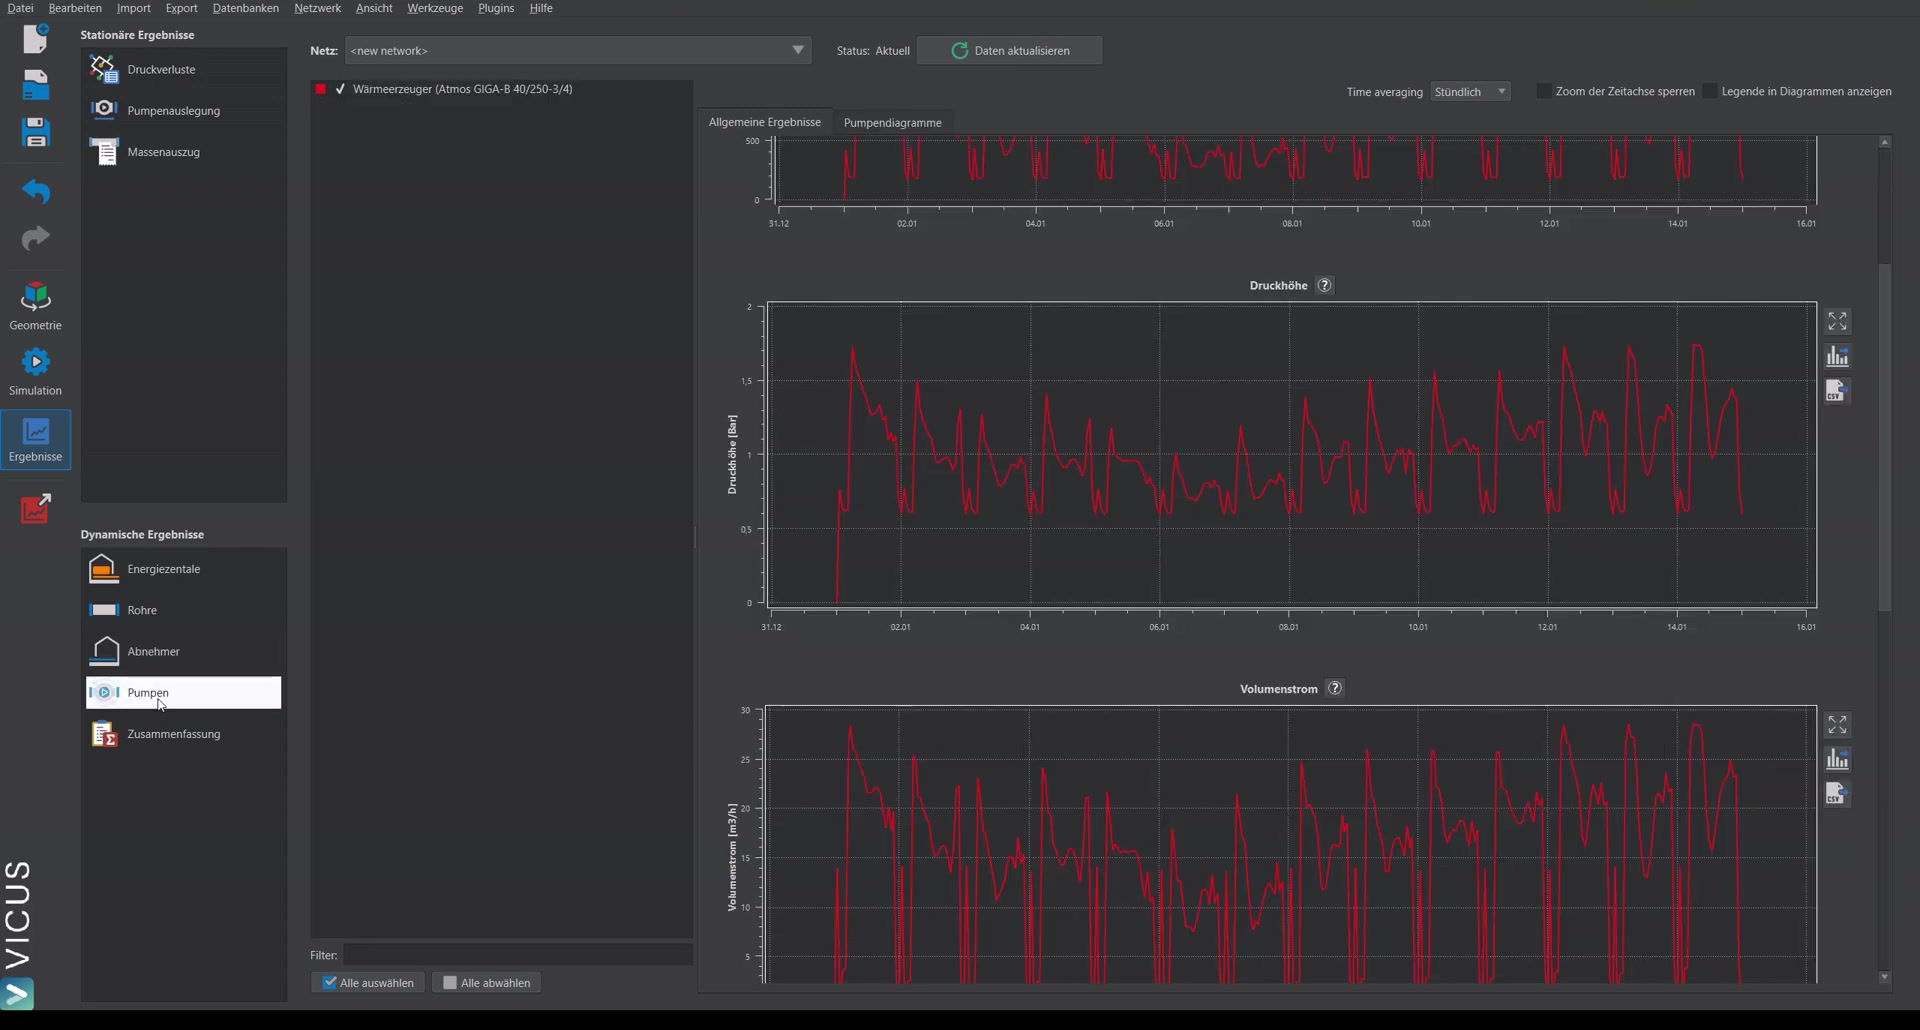
After starting the simulation (e.g. over 14 days), the results show:
Checking the temperature difference
With the simple transfer stations, it is important to check the temperature difference. The desired 15 Kelvin is largely maintained — small overshoots are attributable to the somewhat slower pump control and are usually uncritical.
Pump diagram
The pump diagram shows the difference from constant pressure increase: with worst-point control, the head settles along a quadratic curve. The control follows the system curve, which brings significantly higher efficiency and, above all, a lower electricity demand of the pump.
Head profile
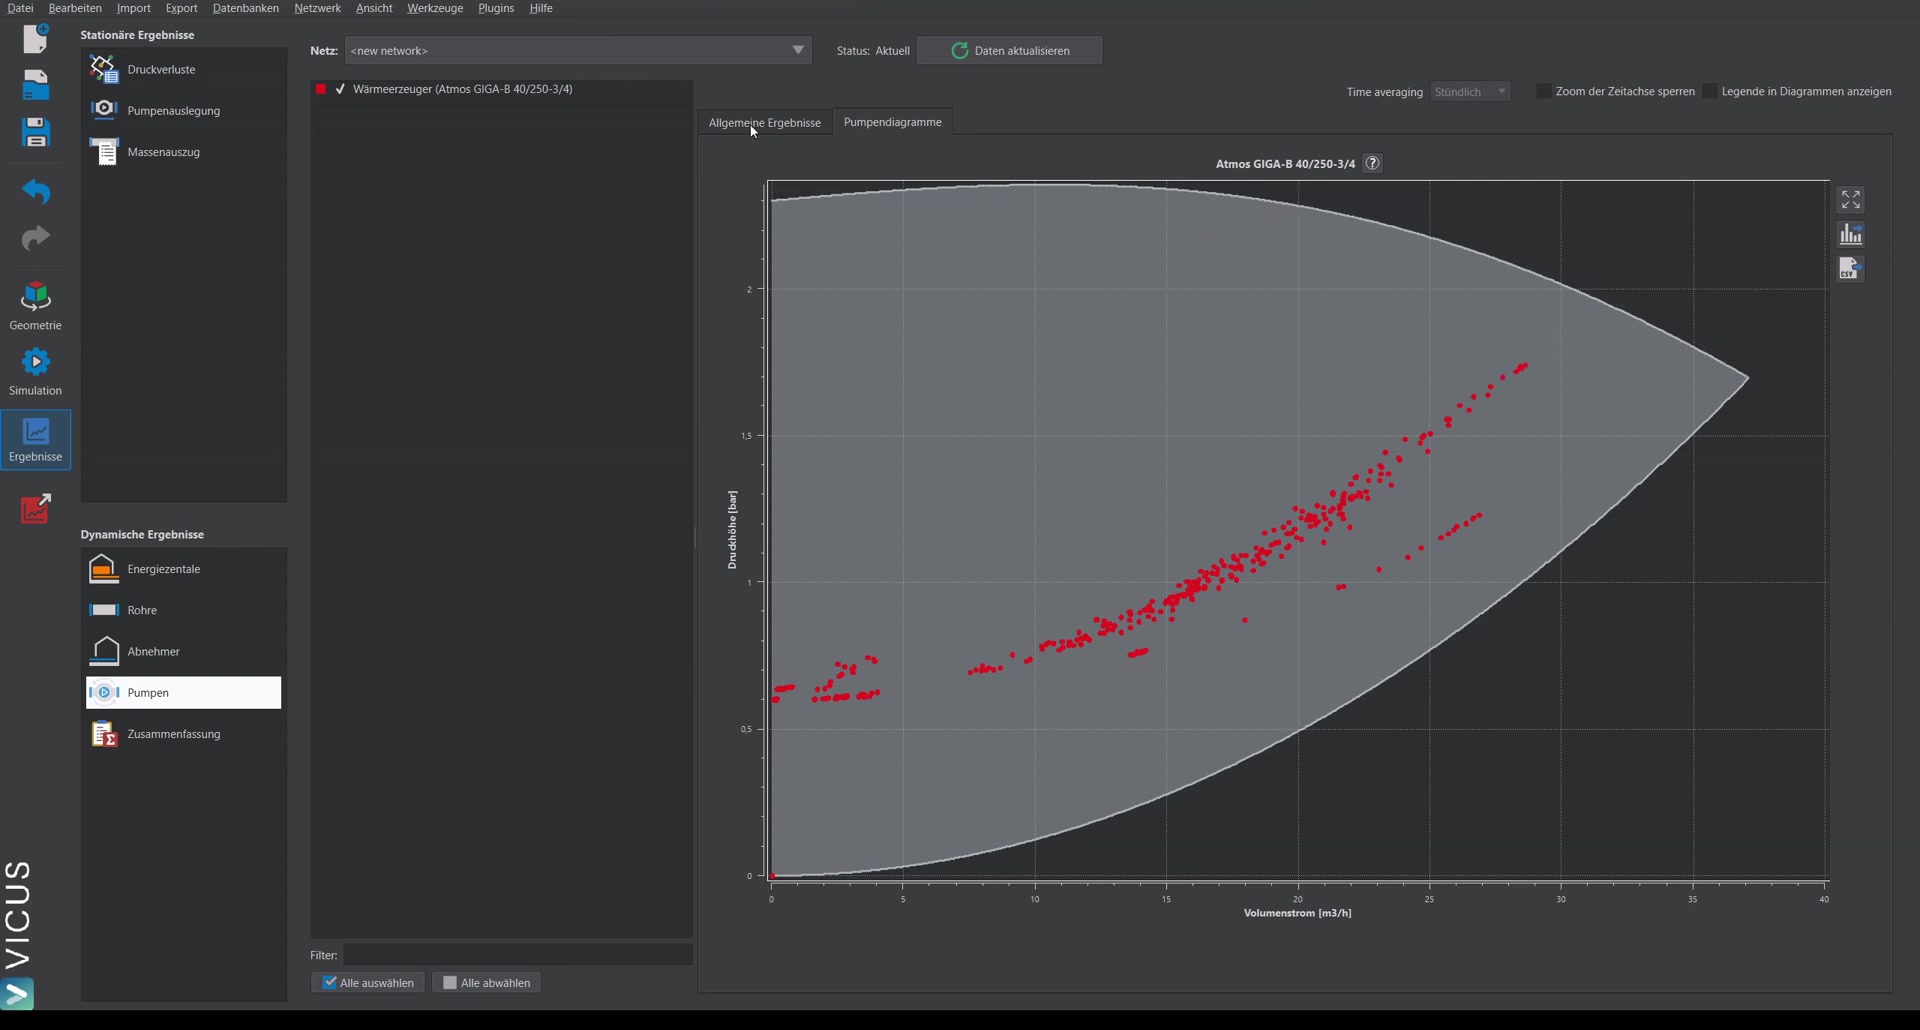
The head profile makes the difference clear: instead of a constant 1.6 bar, the pump moves with the network demand and settles lower when less heat is needed. In the evaluation, this shows up as a lower electricity demand.
By the way:
The savings effect is considerable because the electrical pump power along the system curve falls with the third power of the speed: even a moderate reduction of the head at part load lowers the electricity consumption disproportionately. Since a heat network runs in part load for most of the year, the controlled pump usually pays for itself quickly compared to the constant-delivery pump — while the worst point always remains adequately supplied.