Exporting a network as DXF
Export network plans with pipe dimensions, IDs and calculation results as a DXF file for CAD programs
Overview
The DXF export produces a CAD-ready network plan from the heat network – optionally with separate supply and return, color or layer coding by pipe dimension, labeling of the IDs as well as the results of the steady-state calculation (e.g. volume flow, pressure loss, heat loss). The file can be processed further in all common CAD programs.
Opening
Menu Export > DXF drawing … (only visible when the network perspective is active). After confirming the options, you choose the storage location of the .dxf file.
Exporting the network
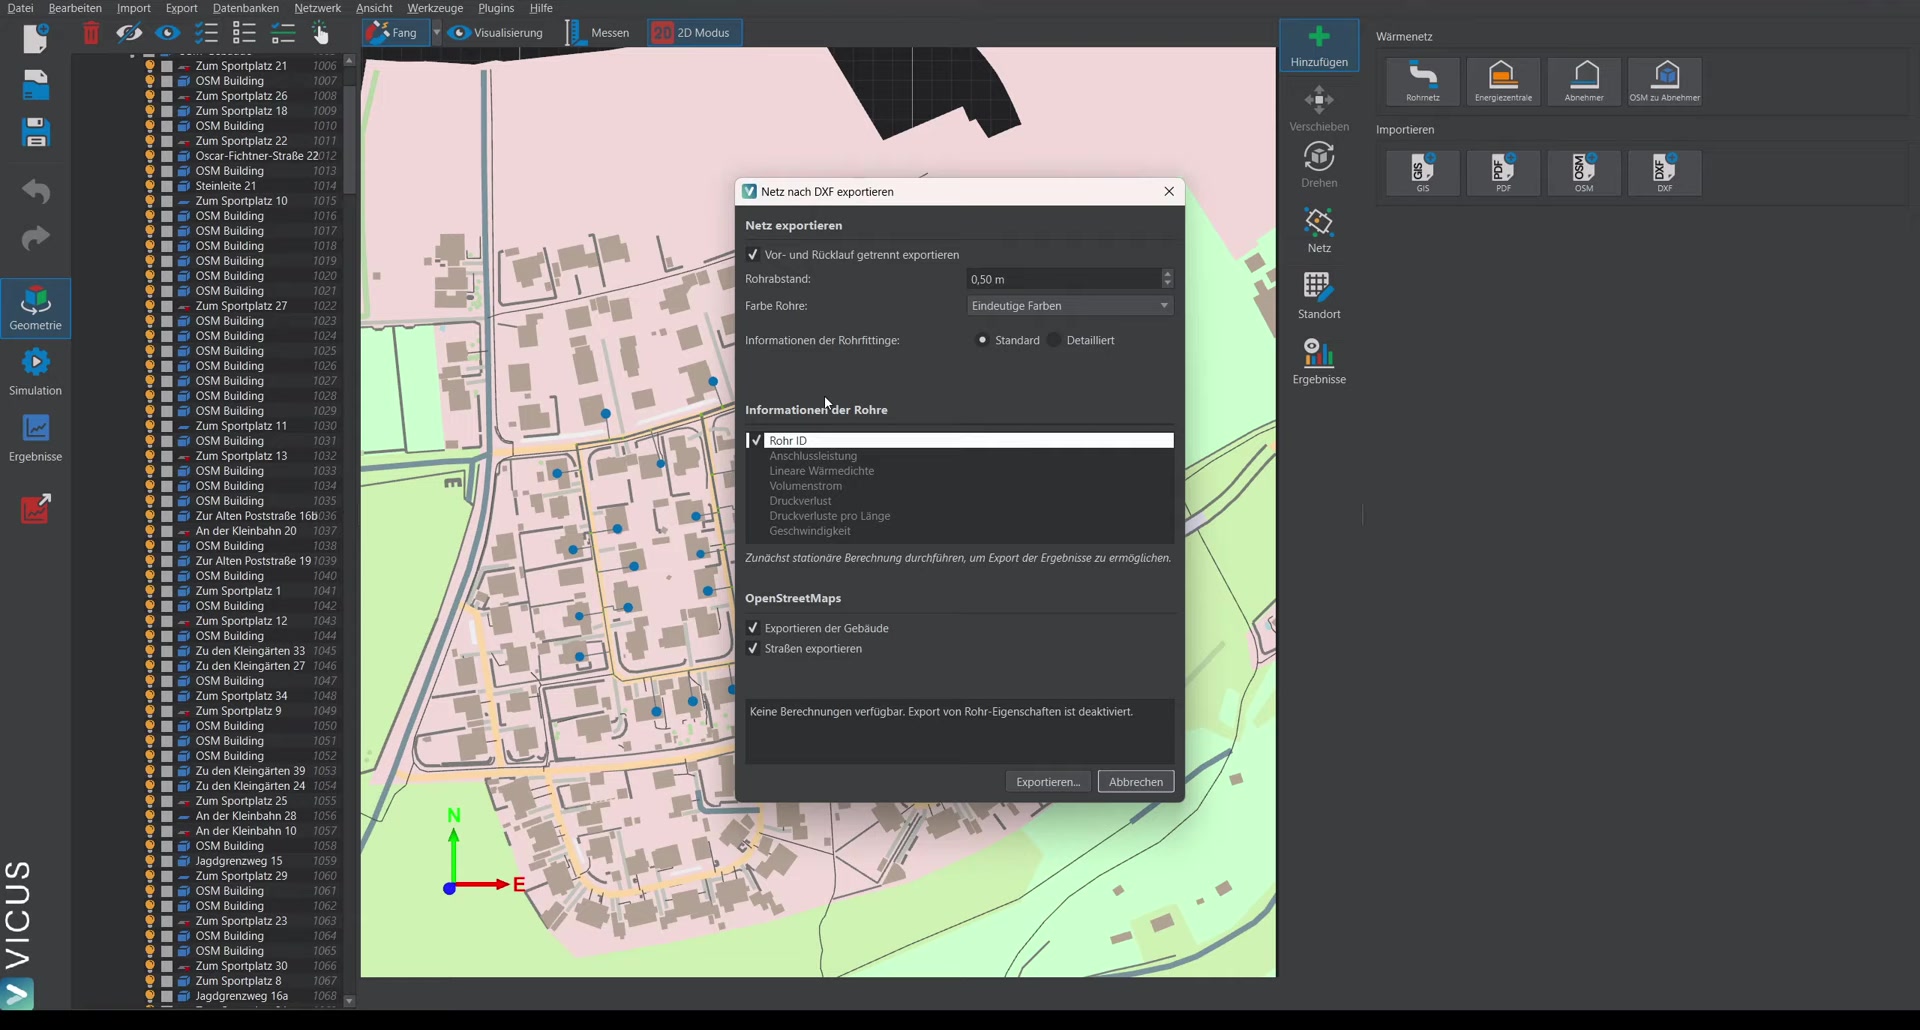
| Option | Default | Meaning |
|---|---|---|
| Export supply and return separately | enabled | Draws two parallel offset lines per route (supply/return). Disabled: one line per route. |
| Pipe spacing | 0.5 m | Offset between the supply and return line (only with separate display). |
| Pipe color | Uniform color | Color and layer scheme of the pipes, see below. |
| Pipe fitting information | Default | Default: only the essential fitting information per node. Detailed: all fittings (bends, T-pieces, reducers) at the node. |
Color scheme
| Setting | Effect |
|---|---|
| Uniform color | Supply and return each receive one color (supply red, return blue). |
| Internal colors | Pipes use the colors from the VICUS pipe database. |
| Unique colors | Pipes are split onto separate layers by dimension; each dimension receives its own color. |
Proven combinations:
| Display type | Recommended color coding |
|---|---|
| Separate pipes (supply/return) | Uniform color |
| One line per route | Unique colors per pipe dimension |
ID export
| Option | Meaning |
|---|---|
| Consumer IDs | Labels each consumer with its ID. |
| Pipe IDs | Labels each route with its ID. |
| Use internal VICUS IDs | Uses the IDs from the project – identical to the IDs in the bill of materials and in the calculation results. |
| Use separate IDs for pipes and consumers | Assigns consecutive, separate number ranges for pipes and consumers – clearer for passing on to third parties. |
Including calculation results
A prerequisite is a previously performed steady-state calculation – otherwise the options are grayed out (note in the dialog: “First perform the steady-state calculation to enable the export of the calculation results.”).
| Option | Meaning |
|---|---|
| Operating point | Selects which calculated operating point (e.g. 100 % load, summer case) is used for the labeling. |
| Pipe properties | Selection of the result quantities that are labeled on each route – e.g. heat loss, heat loss per meter, volume flow, pressure loss, utilization, reserve. |
| Consumer properties | Selection of the result quantities that are labeled on each consumer – e.g. connection load, volume flow. |
| Prepend quantity symbol | Prepends the formula symbol to the number (e.g. “Q = 150 kW” instead of “150 kW”). |
Exporting OpenStreetMap along with it
If OpenStreetMap data is loaded in the project, buildings and streets can be exported along with it as additional layers – this keeps the network plan spatially locatable even without further map material.
In practice
For passing on to third parties (e.g. civil-engineering planners or the municipality), it has proven useful to enable Use separate IDs for pipes and consumers: the consecutive number ranges are clearer than the internal VICUS IDs. But keep in mind that these numbers do not match the bill of materials and the calculation results – for reconciling with your own calculation, use Use internal VICUS IDs.
Georeferenced export for GIS applications
A DXF file is first of all a pure CAD drawing without spatial reference – it sits in local project coordinates around the origin. With the option Write world coordinates for GIS applications, all coordinates are instead shifted by the world coordinate origin of the project and thus written as UTM easting and northing values in meters. The option is only available if a geographic reference has been set for the project.
A DXF file cannot carry the coordinate reference system in a way that a GIS evaluates. The export therefore places two companion files next to the drawing:
| File | Purpose |
|---|---|
network.dxf | The drawing, coordinates already in UTM. |
network.vrt | Small XML wrapper that points to the DXF file and names the coordinate reference system. |
network.prj | Names the same reference system in the customary GIS format. |
All three files belong together and must be copied together when passing them on.
Opening in QGIS
Add the .vrt file as a vector layer instead of the DXF file (Layer > Add Layer > Add Vector Layer … or by dragging it into the map canvas). The layer arrives with the correct coordinate reference system and immediately lines up with background maps and other data.
Opening in other GIS applications
Applications that do not read .vrt files open the DXF file directly. The reference system then has to be assigned by hand – take the EPSG code from the .prj file; it has the form 326xx for the northern and 327xx for the southern hemisphere (xx = UTM zone, e.g. EPSG:32632 for zone 32 north). The coordinates themselves are correct either way, only the statement of the reference system is missing.
Working with the data in the GIS
All elements end up in a single layer. Filtering and styling use the attributes:
Layer– the DXF layer name, i.e. supply/return, pipe dimension, labels, OSM buildings and streets. Use it to filter subsets ("Layer" = '…') or to color the drawing by category.Text– the label text (IDs, result values); the labels are stored as point geometries.
CAD applications do not need the companion files: they read the coordinate reference system from the AcDbGeoData object that the export writes into the DXF file.
Good to know
For getting data into a GIS, the GIS export is usually the better choice: it delivers clean attribute tables with the network and result quantities as individual columns. The georeferenced DXF export makes sense when the finished network plan – with its color coding and labels – is to be placed on a map in the correct position, for instance as a basis for discussion with the municipality.
Structure of the DXF file
- Labels: All selected quantities (IDs, result values) are placed as text at the respective element.
- Layer system: Network elements, labels and OSM data lie on separate layers; with the Unique colors setting, additionally one layer per pipe dimension. Details can thus be selectively shown and hidden in the CAD.