Heating Curves
Heating-curve database: setpoint over outdoor temperature, application types for ideal generator and transfer station, curve types and comparison dialog.
Overview
A heating curve describes a setpoint temperature as a function of the outdoor temperature. It is a database element and thus available across projects. In the network context it provides the temperature setpoint at two places: as the supply temperature of the network for the heat generator in the energy plant, and as the heating curve of the building for the secondary side of the transfer station. The application type defines what a curve is used for – and which curve types are available.
Access
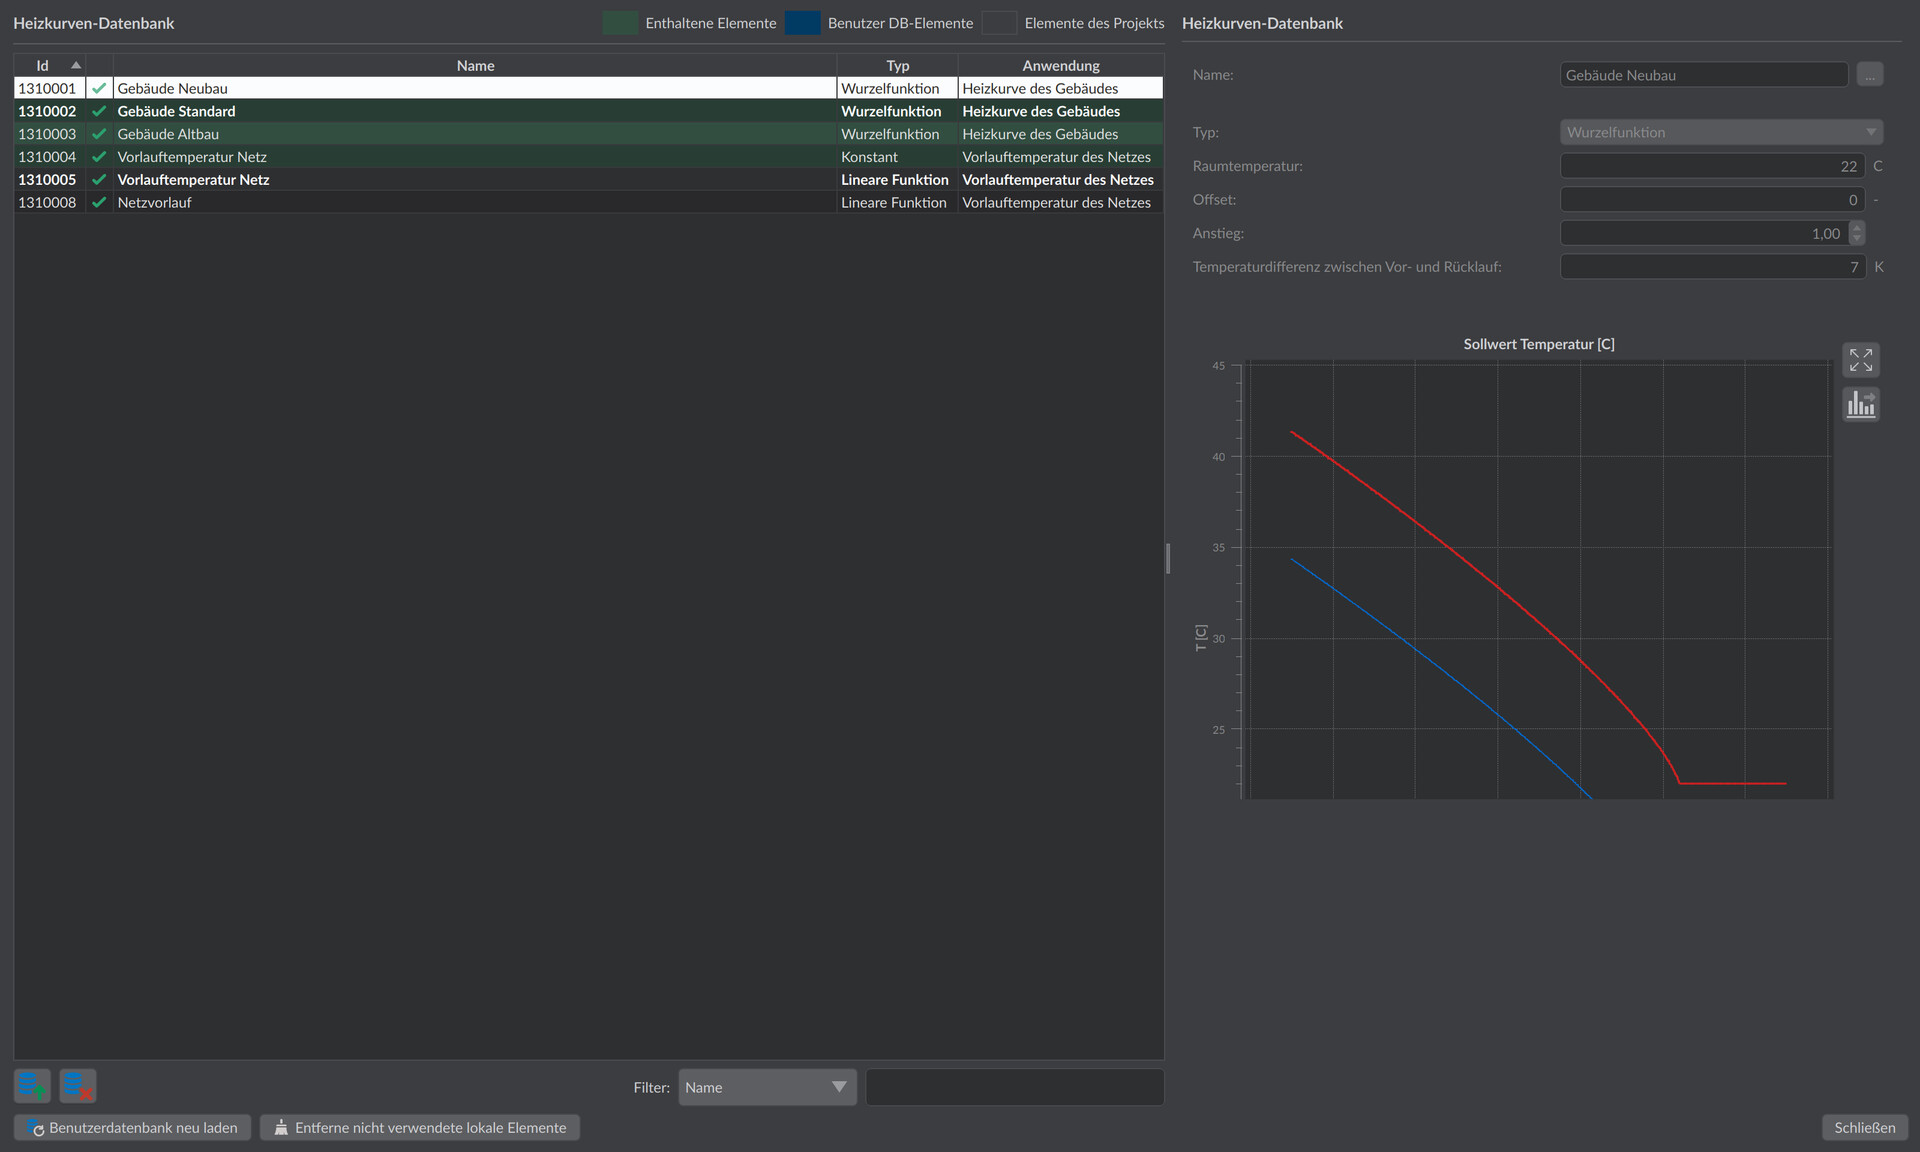
Menu Databases > Heating curves … opens the heating-curve database. The list shows all heating curves with the columns Id, Name, Type (curve type) and Application (application type).
Opened directly from the menu, the dialog is meant for viewing and editing existing curves of both application types; the buttons for adding, copying and removing are hidden here. You create new curves where they are assigned – at the generator component (supply temperature of the network) or in the building demand (heating curve of the building); there the list is filtered to the matching application type and the editing buttons are available.
Application type
Every heating curve has an application type that is set when it is created:
- Supply temperature of the network – setpoint for the heat generator in the energy plant; assigned at the plant component (e.g. the ideal generator).
- Heating curve of the building – supply and return temperature on the secondary side of the transfer station; assigned in the building demand.
The application type also decides which curve types are possible – user-defined time series only exist for the supply temperature of the network:
| Curve type | Supply temperature of the network | Heating curve of the building |
|---|---|---|
| Constant | ✓ | ✓ |
| Linear function | ✓ | ✓ |
| Root function | ✓ | ✓ |
| User-defined time series from values | ✓ | – |
| User-defined time series from file | ✓ | – |
Curve types
The curve type (Type) determines how the setpoint is calculated from the outdoor temperature:
| Curve type | Parameters |
|---|---|
| Constant | Setpoint of the temperature in °C – constant, independent of the weather |
| Linear function | Setpoint at minimum/maximum ambient temperature (°C) as well as minimum/maximum ambient temperature (°C); outside this range the setpoint remains constant |
| Root function | Room temperature (°C), Slope (0.1–3.0) and Offset |
| User-defined time series from values | Enter support points directly or paste from the clipboard |
| User-defined time series from file | Annual time series from a TSV file |
The root function reproduces the typical radiator behavior:
with slope , offset , outdoor temperature and radiator exponent .
The chart in the dialog shows the setpoint over the ambient temperature. For the analytic curves (constant, linear, root) the supply setpoint falls with rising outdoor temperature. Built-in curves are read-only and can be adjusted as a copy.
Supply temperature for the ideal generator
The ideal heat/cold generator – and likewise the simplified energy plant – requires a heating curve of the application type Supply temperature of the network. It provides the setpoint to which the fluid is brought at the generator outlet. The following supply-temperature options are therefore available:
- Constant supply temperature – via a constant heating curve (e.g. 70 °C year-round).
- Weather-compensated supply temperature – via the linear or the root function; the setpoint follows the outdoor temperature.
- Custom time series – as a user-defined time series from values (entered directly or pasted from the clipboard) or from a TSV file, for example a measured or planned supply-temperature profile.
The curve is assigned in the generator settings; the button there opens the heating-curve dialog, filtered to the supply temperature of the network. In the operating mode with a prescribed heating power, the heating curve additionally acts as an upper bound of the supply temperature – see Ideal generator.
Setting the heating curve of the transfer station
The transfer station determines its secondary side (building heating) from a heating curve of the application type Heating curve of the building. It is assigned per consumer in the building demand:
- Select a consumer node in the 3D scene, tab Building demand – or open the table editor via menu Network > Edit building demands ….
- In the Heating curve: field, assign a curve from the database; the same curve can be reused for several consumers.
For this secondary heating curve, only the analytic curve types Constant, Linear function and Root function are available – user-defined time series are not possible here. In addition, the temperature difference between supply and return in K is specified: from it the secondary return temperature results, and the chart then shows both curves – Supply temperature (red) and Return temperature (blue). The Heating curve color mode on the Building demand tab makes the assignments visible in the network. For details on the effect on the secondary side see Transfer station.
Practical tip
Open the heating-curve database directly via Databases > Heating curves …: you then see, in one list, both the supply temperature of the generator and the secondary-side heating curve of the building. This lets you check the decisive condition for the transfer station at a glance – the network supply temperature (generator curve) must lie above the secondary supply setpoint (building curve), and by at least the logarithmic design temperature difference of the station. If the generator curve sits too close to the building curve, the station cannot cover the demand. New curves are still created via the generator or building-demand settings.