Result overview & diagrams
Results view in VICUS Buildings: key-value overview with peak loads and annual energy, time-series diagrams for temperatures, energy balances and heating/cooling loads, legend, data table and chart export.
VICUS Buildings Page 1 of 4 in this chapter
Overview
After a simulation you evaluate the results directly in VICUS Buildings, without an external tool. The results view offers an Overview with the most important key values of the building, the false-color display on the geometry, and Plots with time series and data tables. The data basis is the output files of the last simulation in the project’s result directory (see External evaluation). Which quantities are available depends on the configured outputs.
Access and toolbar
Open the results view via the button  Results in the left main toolbar. A separate toolbar then appears on the right edge of the 3D scene:
| Button | Function |
|---|---|
 Overview | Aggregated result overview: peak loads, annual energy, maximum temperatures, area (see Result overview) |
 False Colors | Results as animated false colors on the 3D geometry, see False-color display |
| Plots | Building result quantities as time-series diagrams and data tables (see Plots) |
If the project also contains a district heating network, the buttons for the network results appear as well. The labels then have two lines so that the building and network views stay distinguishable: Overview Buildings, Overview Networks, Plots Buildings and Plots Networks.
In the results view, the info bar below the scene is hidden.
Result status and reloading
At the top of the results panel, visible on all tabs, a status line summarizes the state of simulation, project and data cache (e.g. Results up-to-date, Simulation running, Project changed since last run, Result files changed on disk, No results yet). Details expands the individual entries Simulation:, Project:, Result directory: and Data cache:. The button next to them opens the result directory in the file manager.
The button  Reload results reads in all result files that changed on disk, e.g. after another simulation run. Until then, the diagrams keep showing the data that is already loaded. During a running simulation, VICUS Buildings checks the file status automatically once per second.
Result overview
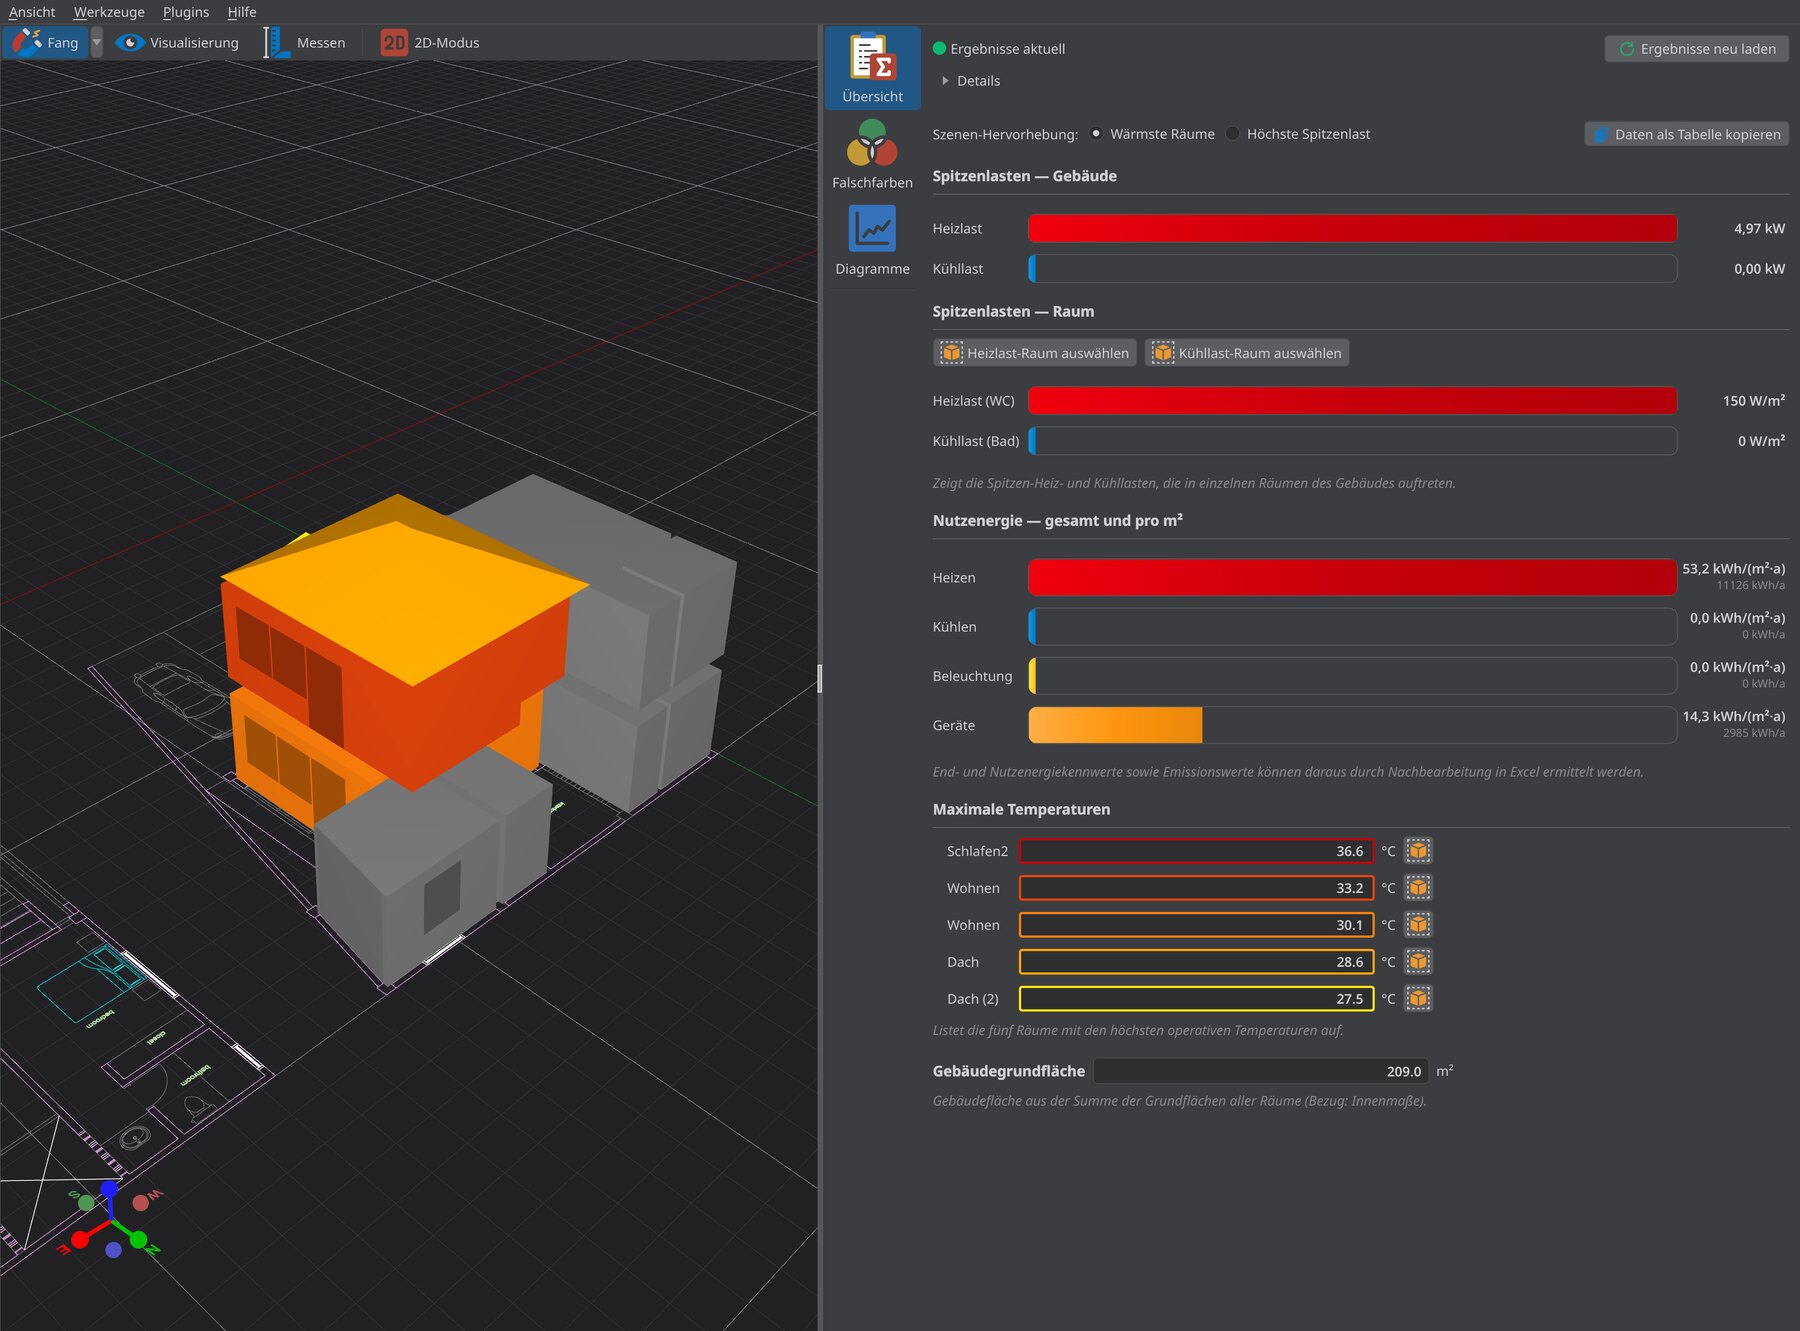
The tab Overview shows the Result Overview, a summary of the building’s most important key values as bars and value fields:
| Section | Content |
|---|---|
| Peak loads — building | Highest heating and cooling load of the entire building in kW |
| Peak loads — room | Highest room-related heating and cooling load in W/m², with the name of the room |
| Useful energy — total and per m² | Annual energy for Heating, Cooling, Lighting and Equipment in kWh/(m²·a), plus the total in kWh/a |
| Maximum temperatures | The five rooms with the highest operative temperatures in °C, marked in color by rank |
| Building floor area | Sum of the floor areas of all rooms in m² (inside-dimension reference) |
The overview gives the cooling load as a magnitude. In the result files it is negative and the heating load is positive. Hint boxes below the sections explain the values. Final-energy, useful-energy and emission figures can be derived from the useful-energy values via post-processing in Excel.
The basis is the output files IdealHeatingLoad-mean, IdealCoolingLoad-mean, ConvectiveLightingHeatLoad-mean, ConvectiveEquipmentHeatLoad-mean and OperativeTemperature. They are written automatically when the option Generate default building-related outputs is enabled, see Outputs.
Controls:
- Scene highlight: colors the 3D scene to match the overview:
- Hottest rooms: the rooms with the highest operative temperatures appear in a ranking from dark red to yellow, in the same colors as under Maximum temperatures.
- Highest peak load: the room with the highest room-related heating load appears red, the room with the highest cooling load blue.
- All other rooms stay gray.
 next to the room entries (Select heating-load room, Select cooling-load room, Select this room in the 3D scene): selects the room with all its surfaces, scrolls the navigation tree to it and aligns the camera to it.
 Copy data as table: copies the entire overview to the clipboard as tab-separated text that can be pasted directly into Excel. A message confirms the copy.
Plots
The tab Plots shows result quantities as time series. It consists of two parts: the Diagrams panel on the right, where you create and manage diagrams, and the diagram area below the 3D scene, which displays them.
When you open the tab, VICUS Buildings reads in only the result files that the configured diagrams actually need.
The “Diagrams” panel
The table lists all diagrams stored in the project with the columns Type and Description and two icon columns. The icons are explained below the table:
- Plot visibility: light bulb on (Visible) or off (Hidden). Clicking the icon shows or hides the diagram in the diagram area.
- Cache and data status:
 Up-to-date: the data is read in and up to date.
 Reload: the result files are present but not yet read in, or outdated.
 Missing: a required result file is not yet or no longer present.
The buttons below the table:
| Button | Function |
|---|---|
 Add diagram | Opens the dialog Create new diagram |
 Edit diagram | Opens the Diagram Options of the selected diagram (only with exactly one diagram selected) |
 Remove diagram | Removes the selected diagrams |
| Light bulb on | Make the selected plots visible |
| Light bulb off | Hide the selected plots |
Use Ctrl- or Shift-click to select several diagrams and remove, show or hide them together. The input field Filter plots by name… hides all rows whose type or description does not contain the text. All changes can be undone. The diagrams are saved with the project.
Clicking a row makes the diagram the active diagram (see Diagram area). The expandable section Required output files lists all result files needed by the selected diagram (column Output file) with the same status icon. Files that are not present appear gray with the suffix (not available). This shows at once which output a diagram is missing.
Diagram types
| Diagram type | Lines | Required output files |
|---|---|---|
| Temperatures | One line per room (operative temperature by default) plus the Ambient temperature | Temperature, AirTemperature, OperativeTemperature |
| Energy balances | Stacked time series of the heat flows, summed over the chosen rooms: equipment load, lighting load, person load, cooling load, heating load, solar gains, ventilation heat load, convection through walls and windows; plus the Total thermal load as a dashed check line | internal loads, ideal heating/cooling load, WindowSolarRadiationLoad-mean, VentilationHeatLoad-mean, heat flows of the constructions, CompleteThermalLoad-mean |
| Energy balances (integrals) | The same balance shares as monthly or annual bars | as for energy balances |
| Heating / cooling loads | One heating and one cooling line per zone or per building | IdealHeatingLoad-mean, IdealCoolingLoad-mean, plus ActiveLayerThermalLoad-mean with surface heating |
Rooms that you hide in the navigation tree disappear from the diagrams. The energy balances and heating/cooling loads sum only the visible rooms.
Create new diagram
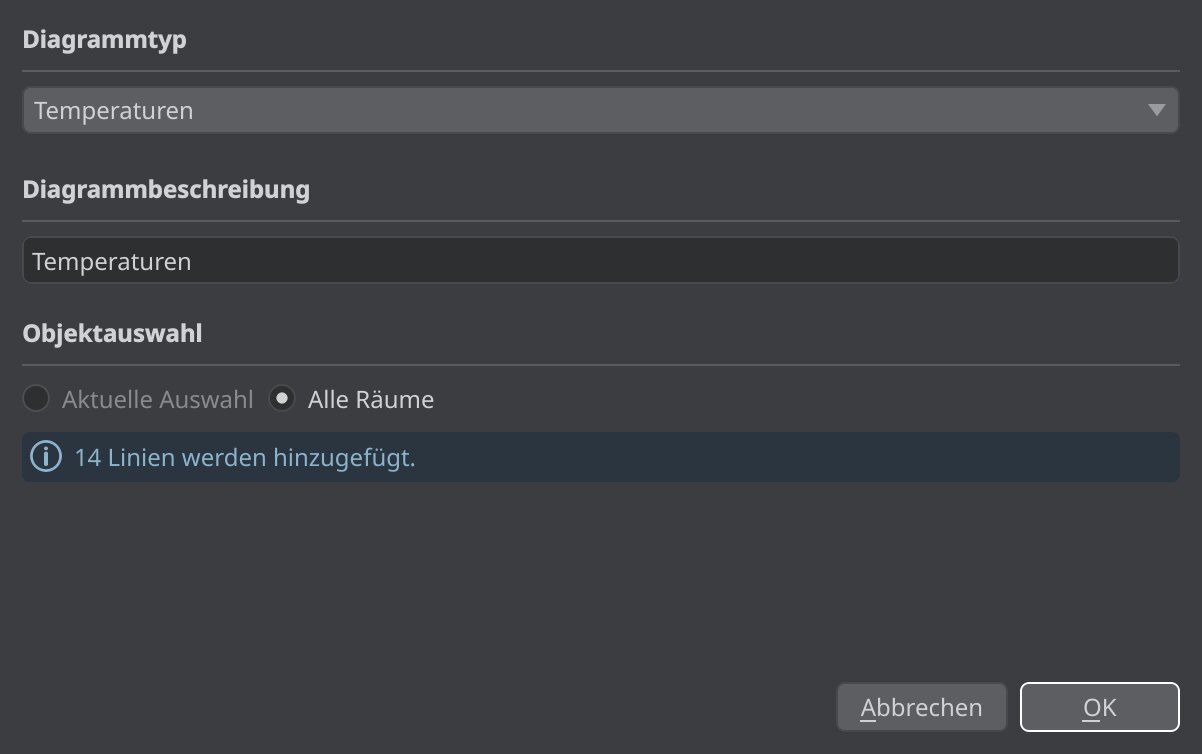
The dialog Create new diagram has three sections:
- Diagram type: one of the four types from the table above.
- Diagram description: the name of the diagram. It is prefilled from the diagram type, prefixed with the room name if exactly one room is selected. If a diagram with this description already exists, a warning appears. On confirmation, the existing diagram is overwritten after a prompt.
- Object selection:
- Current selection: only the rooms selected in the scene. This option is preselected if rooms are selected when the dialog opens. Without a selection it is disabled.
- All rooms (All zones for heating/cooling loads): all rooms of the project.
A hint shows how many lines the diagram will get (N lines will be added.). A temperature diagram contains only the chosen rooms plus the ambient temperature. A heating/cooling load diagram shows each selected zone individually with Current selection, and one heating and one cooling line per building with All zones.
Diagram options
Edit diagram opens the dialog Diagram Options. Its content depends on the diagram type:
| Diagram type | Options |
|---|---|
| Temperatures | Show air temperatures or Show operative temperatures |
| Energy balances, energy balances (integrals) | List Zones to be used in diagram with Entire building and Use currently selected zones; Exclude internal walls when accumulating energy flows. For the integrals only, also Show total energy consumption (kWh) (otherwise mean powers in kW) and Show annual balances (instead of monthly balances) |
| Heating / cooling loads | Aggregation level: Per zone, Per building or Total over all zones; Element selection with Select all and Select none |
Diagram area
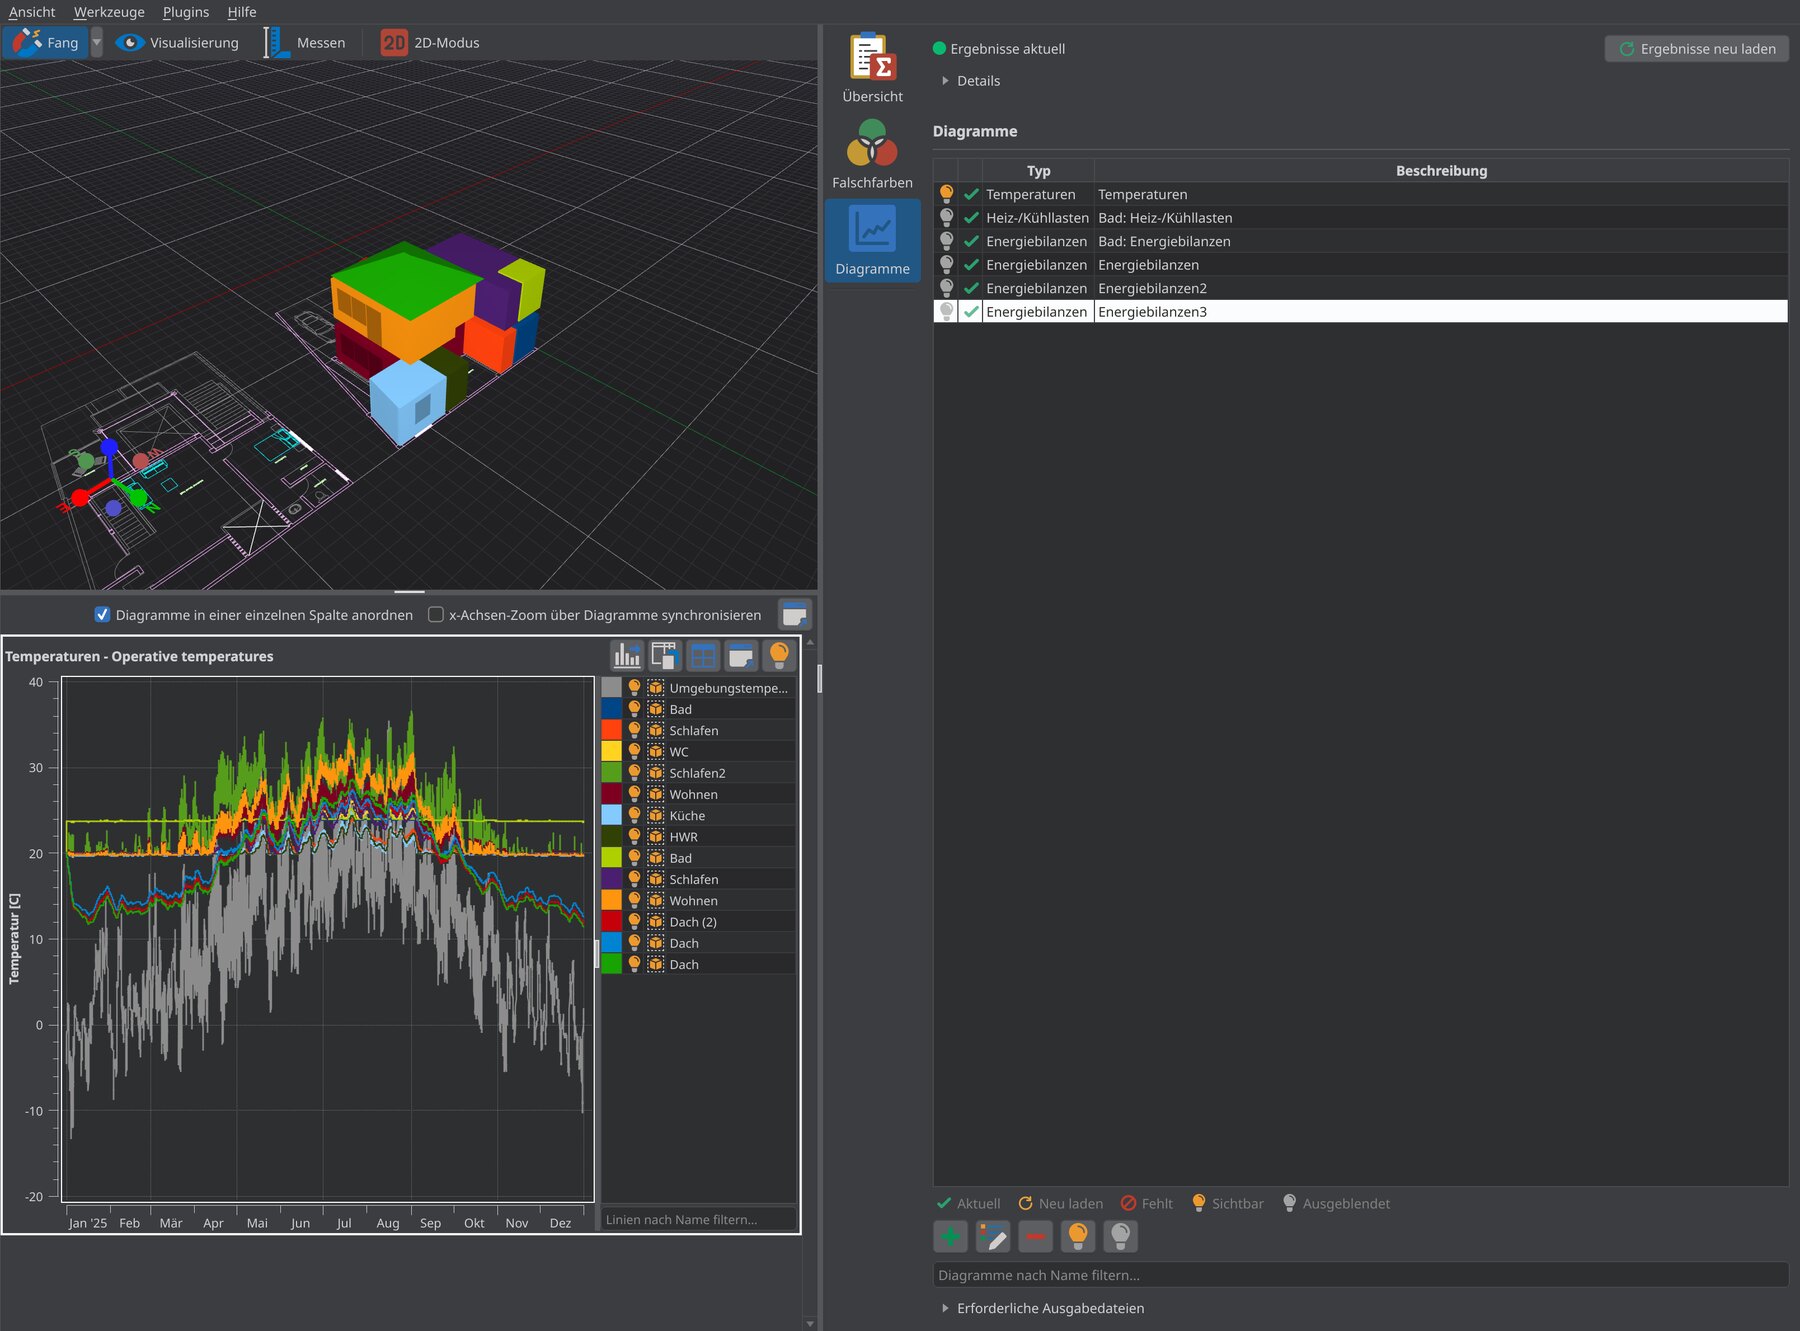
All visible diagrams appear in the diagram area below the 3D scene. The header row of the area contains:
- Stack plots in a single column (enabled by default): the diagrams are stacked one below the other. Without this option, VICUS Buildings arranges them automatically in a grid.
- Sync x-axis zoom across plots: zooming in one diagram applies the time range to all other diagrams. This also applies to resetting with a right-click.
 : undocks the whole diagram area into a free-floating window Result diagrams (at least 900 × 600 pixels), e.g. for a second screen. Clicking again or closing the window docks the area back.
Clicking into a diagram makes it the active diagram. It gets a colored frame and a bold title, and the matching row in the panel is selected. The 3D scene follows the active diagram:
- For temperature diagrams and heating/cooling loads per zone, the rooms get the color of their line (for heating/cooling loads, that of the heating line). Rooms whose line is hidden stay gray.
- For energy balances and for heating/cooling loads per building or as a total, the included rooms appear white and all others gray.
Zooming and panning with the mouse:
- Drag a rectangle with the left mouse button: zoom in
- Right-click: go back one zoom level
- Ctrl + right-click: zoom out completely
- Hold the middle mouse button and drag: pan the view
Diagram header
Each diagram has a title above the plot and its own buttons:
| Button | Function |
|---|---|
 | Export this diagram as an image file (PNG, PDF, SVG, …), see Exporting a diagram |
 | Copy the diagram data to the clipboard as a table (tab-separated, can be pasted directly into Excel). If a range is selected in the data table, only that range is copied, always together with the time column |
 / | Toggles between diagram and table view (Show data table / Show diagram) |
| Undocks the single diagram into a free-floating window. Clicking again docks it back; closing the window hides the diagram |
| Hide/Close | Hides the diagram. It can be shown again via the light bulb in the panel |
Legend
To the right of the plot, the legend is shown as a table with one row per line:
| Column | Function |
|---|---|
| Color swatch | Click to open a color dialog and change the line color |
| Light bulb | Click to show or hide the line |
| Select associated object in scene: selects the room with all its surfaces, scrolls the navigation tree to it and aligns the camera to it |
| Name | Double-click to show only this line, double-click again to show all lines |
Line color and visibility are stored in the diagram and can be undone.
The input field Filter lines by name… below the legend hides all lines whose name does not contain the text, both in the legend and in the plot. The corresponding rooms are shown gray in the 3D scene. This way you can, for example, isolate a single storey via a common part of the room names.
It also works the other way round:
- Clicking a line in the plot selects the corresponding room in the scene.
- Selecting in the scene: if rooms are selected, their line is drawn thicker and in front. The lines of all other rooms turn gray, and their legend entries are dimmed.
Data table
The table view shows the values of the diagram in display units. The first column Time contains date and time, followed by one column per line. Its heading gives the line name plus quantity and unit, e.g. [°C]. Headings of visible lines are highlighted in the line color. Select a contiguous range to copy only that range via .
Exporting a diagram
The dialog Export chart creates a graphic of the diagram:
- Show title and Show legend: the legend is placed below the plot. With more than ten visible lines it is off by default.
- Tab Bitmap: Size: in mm or px, Resolution: in dpi, Keep aspect ratio, Scale plot items/fonts with resolution and a preview. File formats: PNG, BMP, GIF, JPEG.
- Tab Vector graphics: Size (width/height): in mm, Keep aspect ratio, Paint chart background (no transparency) and Use data reduction during export. File formats: PDF, SVG.
- Copy to clipboard or Export to file…: after exporting to a file, its path is copied to the clipboard.
The default size is 160 × 90 mm, which corresponds to the text width in Word at an aspect ratio of 16:9. The diagram title is suggested as the file name. VICUS Buildings remembers the last export directory; initially it is the project directory.
Good to know
A typical workflow for an overheating check: in the Overview, find the critical rooms with Hottest rooms and select them with . Then create a temperature diagram under Plots with Current selection. It contains only these rooms and the ambient temperature. With Sync x-axis zoom across plots and a second diagram of the heating/cooling loads, you see temperature and load of the same heat period directly one below the other.