Software for Heat Planning and Heat Networks: an Overview
Software for municipal heat planning and district energy concepts: tool categories from heat cadastre to network simulation, with data, results and phases.
Table of Contents
Heat planning software cannot be described as a single product category. Between a municipality’s first heat cadastre and the detailed design of a heat network lie several planning steps, each requiring different input data, a different level of model detail and different results. This article classifies the common tool categories along the planning chain: what they are for, what data they need, what they deliver and in which project phase they are typically used. It assesses categories, not individual products.
The planning chain: from municipality to network
Since the German Heat Planning Act (Wärmeplanungsgesetz, WPG) came into force on 1 January 2024, federal states and municipalities are obliged to draw up heat plans – by 30 June 2026 for municipalities with more than 100,000 inhabitants and by 30 June 2028 for smaller ones. Municipal heat planning essentially consists of an inventory analysis, a potential analysis, a target scenario, the division of the municipal area into prospective heat supply areas, and an implementation strategy.
A heat plan is strategic planning, not network design. It identifies areas likely to be suitable for a heat network but does not size any pipes. These are worked out afterwards on a project basis, often through a feasibility study under Module 1 of the BEW (German Federal Funding for Efficient Heat Networks) and then through the planning phases of a heat network (see planning phases of thermal networks).
Along this chain the spatial scale decreases and the physical level of detail increases:
| Phase | Scale | Typical question | Tool category |
|---|---|---|---|
| Inventory analysis (WPG) | Municipality | Where is how much heat consumed? | Heat cadastre / GIS heat atlas |
| Potential analysis (WPG) | Municipality | Which renewable sources and waste heat exist? | Potential analysis, GIS |
| Target scenario, supply areas (WPG) | Municipality / district | Network or decentralised? Which option? | Scenario and pre-planning tools |
| District concept, BEW feasibility study | District / network | Is a specific network technically feasible? | Network calculation, thermo-hydraulic simulation |
| Design and permit planning | Network / building | Diameters, temperatures, pumps, storage | Thermo-hydraulic simulation, building simulation |
| All phases from pre-study onwards | Project | Is it economically viable? | Economic analysis |
Heat cadastre and GIS heat atlas
Purpose: Spatial representation of heat demand and consumption – per building or aggregated to blocks, street sections or grid cells. The heat cadastre is the data basis of the inventory analysis and is usually maintained in a geographic information system (GIS).
Input data: Building geometries (official cadastral data, 3D building models), building type and construction period, metered consumption data from network operators, chimney sweep data on heating systems, existing networks and infrastructure. Where consumption data are missing, demand is estimated from typological benchmarks.
Results: Maps of heat demand density, heat line density per street, distribution of energy carriers and construction periods. These indicators are the first criterion for delineating a supply area.
Limitations: A cadastre shows demand, not time series. Simultaneity, peak loads and network losses are not part of its output.
Potential analysis
Purpose: Identifying the technically and economically usable heat sources in the municipal area: waste heat from industry and commerce, wastewater, surface water, shallow and deep geothermal energy, open-field solar thermal, biomass. Savings potential from building refurbishment is added.
Input data: Geological and hydrogeological maps, land use and protected areas, waste heat surveys of companies, sewage plant and water body data, climate data.
Results: Spatially located potentials with capacity or annual energy and temperature level – the latter later helps determine the network temperatures and the use of heat pumps.
Tools: Mostly GIS applications with dedicated analysis modules, partly state portals (solar, geothermal and waste heat cadastres) as data sources.
Scenario and pre-planning tools
Purpose: Comparing supply options at municipal or district level – for example heat network versus decentralised heat pumps, different generation portfolios, connection rates and refurbishment pathways up to the target year. The result is the target scenario of the heat plan or the preferred option of a district concept.
Input data: Results from the heat cadastre and potential analysis, energy price and emission pathways, cost benchmarks for generators and networks, assumptions on refurbishment and connection rates.
Results: Energy and greenhouse gas balances per scenario and milestone year, approximate levelised cost of heat, areas suitable for heat networks.
Limitations: In this category networks are typically represented by benchmarks (lump-sum losses per metre of route, average costs per metre). Pipe diameters, pressures and temperatures in the network are not calculated. That is sufficient for the suitability question – but not for the question of whether a specific network works.
Network calculation and thermo-hydraulic simulation
Purpose: Design and verification of a specific heat network – from the district concept and BEW feasibility study to detailed design. Two levels of calculation should be distinguished:
- Steady-state network calculation: pressure loss, pipe sizing, index point and pump sizing for individual operating points, typically the design case. Sufficient for many branched networks with a single producer.
- Dynamic thermo-hydraulic simulation: coupled calculation of pressure, mass flow and temperature over a period, usually one year. Required for multiple feed-in points, low network temperatures, summer part load, storage or cold district heating with ground coupling (see thermo-hydraulic simulation).
Input data: Route (GIS, CAD), pipe system and installation method, consumers with load profiles, producers and control strategy, terrain heights, soil properties.
Results: Pipe diameters and bills of quantities, pressure and temperature profiles, heat losses, pump energy, peak loads and heat delivered per producer. These quantities are needed in the BEW feasibility study to describe the target state and for the cost calculation (see BEW funding).
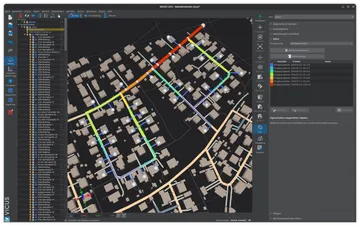
Where VICUS Districts fits
VICUS Districts belongs to this category: networks are imported from GIS data (Shape, GeoJSON, GeoPackage) or drawn, sized in steady state and then simulated dynamically and thermo-hydraulically – for district heating, local heating and cold district heating with a finite-volume ground model. The software does not cover inventory analysis, potential analysis or scenario comparison at municipal level; an economic analysis is not integrated either – bills of quantities, heat losses and pump energy are exported for that purpose. How the simulation works in a project is described on the page heat network simulation.
Building simulation
Purpose: Dynamic thermal simulation of individual buildings or groups of buildings – to determine heating and cooling loads, energy demand, room temperatures and summer thermal protection. Relevant in heat planning when consumer load profiles need to be more reliable than standard profiles, when refurbishment options are assessed at building level, or when checking which supply temperature an existing building needs for a low-temperature network.
Input data: Building geometry (IFC, CAD), construction assemblies, windows and shading, usage profiles, climate data (e.g. test reference years).
Results: Hourly heating and cooling loads, annual energy demand, operative room temperatures, overheating degree hours.
Limitations: The modelling effort per building is high; for entire municipalities, typologies are therefore used rather than individual simulations. Moisture and hygrothermal questions in building components are a separate discipline with dedicated tools such as DELPHIN (see hygrothermal simulation).
Where VICUS Buildings fits
VICUS Buildings is software for dynamic thermal building simulation: energy demand, thermal comfort and summer thermal protection, with geometry import from IFC, DXF and PDF. Thermal bridges are not accounted for via a surcharge. HVAC system modelling is in beta. Climate data such as test reference years can be prepared and exported with VICUS Climate.
Economic analysis
Purpose: Assessing investment, operating and energy costs over the service life – for selecting options, funding applications and heat prices. The standard method is the annuity method according to VDI 2067.
Input data: Investment costs (from bills of quantities and cost benchmarks), energy and maintenance costs, heat quantities and losses from technical planning, funding rates, interest rate and assessment period.
Results: Annuities, levelised cost of heat, sensitivities to energy prices and connection rate, basis for tariff design.
Tools: Often spreadsheets with project-specific templates, sometimes modules within scenario tools. Reliability depends directly on the technical inputs: a levelised cost of heat calculated with lump-sum network losses is only as accurate as the lump sum. For first estimates there are free online calculators, for example for levelised cost of heat and BEW funding.
Selection criteria
Which combination of tools makes sense depends less on the software than on the question at hand:
- Planning phase: For the heat plan, cadastre, potential analysis and scenarios are sufficient. A BEW feasibility study requires a network calculation with pipe diameters, pressure and temperature conditions.
- Network type: Conventional high-temperature networks with a single producer can be calculated in steady state in early phases. Low-temperature networks, multiple feed-in points and cold district heating require a dynamic simulation.
- Data flow: Breaks between GIS, network calculation and economic analysis cost time and introduce errors. Open formats (Shape, GeoJSON, GeoPackage, DXF, CSV) and exportable results matter more than a single tool that promises everything.
- Traceability: For funding bodies and councils, assumptions and results must be documented and verifiable. For simulation tools this includes the question of whether hydraulic and thermal equations are actually solved or whether benchmarks are used.
An overview of the path from municipal heat planning to a designed network from a utility’s perspective is given on the page software for municipal heat planning and utilities.
Sources
- Gesetz für die Wärmeplanung und zur Dekarbonisierung der Wärmenetze (Wärmeplanungsgesetz – WPG) of 20 December 2023, BGBl. 2023 I No. 394.
- Federal Office for Economic Affairs and Export Control (BAFA): Richtlinie für die Bundesförderung für effiziente Wärmenetze (BEW).
- VDI 2067 Part 1 — Economic efficiency of building installations – Fundamentals and economic calculation.
- Nussbaumer, T.; Thalmann, S.; Zaugg, D.; Cueni, M. (2025): Planungshandbuch Thermische Netze. Version 2.0, EnergieSchweiz / Swiss Federal Office of Energy SFOE.
Frequently Asked Questions
Which software is needed for municipal heat planning?
What is the difference between a heat cadastre and a network simulation?
Which software is suitable for a district energy concept?
Related Articles
Heat demand density, connection density, and key customers: Criteria for delineating the supply area of thermal networks
Planning phases of thermal networks: From the supply area through design to operation. The six steps of district heating network planning at a glance.
Disclaimer: The content of this page is for general information purposes only and does not constitute legal, planning or engineering advice. All information is provided without guarantee. Despite careful research, VICUS Software GmbH assumes no liability for the accuracy, completeness or timeliness of the information provided. Third-party product names and trademarks are mentioned for informational purposes only and are the property of their respective owners.