Supply Area and Heat Demand Density
Heat demand density, connection density, and key customers: Criteria for delineating the supply area of thermal networks
Table of Contents
The supply area of a district heating network is delineated iteratively: key customers with high power demand (> 50 kW) form the starting point, zones with a heat demand density above 70 kWh/(a·m²) are considered suitable, and a connection density of at least 1.2 MWh/(a·m) ensures the economic viability of the route alignment. This first and most critical planning step determines which buildings and neighborhoods are connected, where the pipeline route runs, and how large the generation plant must be dimensioned.
Heat Demand Density as a Suitability Criterion
Heat demand density indicates how much heat is required per year and per square meter of zone area. It serves as an area-based indicator for the suitability of an area:
The higher the heat demand density, the more economically a network can be operated in the respective area. The following table provides reference values:
| Suitability | Heat demand density [kWh/(am²)] |
|---|---|
| Not suitable | < 50 |
| Conditionally suitable | 50 — 70 |
| Suitable | > 70 |
Purely single-family house areas typically achieve only 15 to 30 kWh/(am²) and are generally not viable for thermal networks. Multi-family housing areas, village and town centers, and zones with dense development are significantly higher and are suitable as starting points for network planning.
As a supplementary criterion, the floor area ratio can be used, the ratio of gross floor area to land area. A high value indicates dense development and thus a higher heat demand density.
Identifying Key Customers
Key customers are heat consumers with a high power demand (> 50 kW) and/or a high energy consumption (> 2,000 full-load hours per year). Their connection forms the economic foundation of the network because they ensure a stable base demand.
Typical key customers include:
- Industrial facilities with process heat demand and high full-load hours
- Multi-family housing blocks and developments with central heat distribution
- Village and town centers with high building density
- Zones with dense development (schools, hospitals, administrative buildings, shopping centers)
The recommended procedure for integrating key customers is divided into four steps:
- Identify key customers: locate buildings with high heat demand in the potential supply area.
- Secure contractual commitment: obtain letters of intent to increase planning certainty.
- Define potential route alignment: lay the pipeline route so that key customers are efficiently connected.
- Acquire additional customers along the route: win buildings in the immediate vicinity of the planned route as additional consumers.
Key Customer Survey
To refine the supply area, a structured survey of potential key customers is conducted. The questionnaire should capture at least the following information:
- Basic interest in connection (Yes/No)
- Possible connection date
- Heat demand broken down by space heating, domestic hot water, and process heat (in kWh/a)
- Required connection capacity (in kW)
- Energy reference area (in m²)
- Required temperature level (in °C)
- Planned renovation intentions
Based on the collected data, a spreadsheet-based database is built in which each building has its own data record. The data must then be validated: the specific heat demand (in kWh/(m²a)) for residential buildings should typically range between 40 and 200 kWh/(m²a), and full-load hours between 1,500 and 2,500 h/a. Outliers indicate erroneous data or atypical usage profiles and must be clarified on a case-by-case basis.
Connection Density
Connection density relates the heat consumption of connected customers to the pipeline route length:
It is an economic indicator and must not be confused with the area-based heat demand density. The following table shows reference values for different conditions:
| Development stage | Simple conditions [MWh/(am)] | Complex conditions [MWh/(am)] |
|---|---|---|
| First development stage | > 0.7 | > 1.4 |
| Full buildout | > 1.2 | > 2.0 |
Simple conditions refer to favorable installation conditions (e.g., unpaved terrain, no utility crossings), while complex conditions refer to inner-city installation with road excavation and high coordination effort. The investment cost per MWh sold decreases disproportionately with increasing connection density; a dense network distributes the high fixed costs of civil engineering across more consumers.
Heat Distribution Losses
The heat distribution losses of a thermal network depend on several factors:
- Pipe dimensioning and insulation thickness
- Temperature level (supply and return temperature)
- Connection density
- Annual operating duration
- Installation method and soil conditions
The relative loss ratio can be estimated approximately as follows:
The target value is that heat distribution losses should be <= 10% of useful heat demand. This value is generally achievable at a connection density of more than 1.8 MWh/(am).
At connection densities below 1.8 MWh/(am), relative losses can be significantly above 10%. In such cases, a detailed economic analysis is required to determine whether the network is viable despite increased losses, or whether decentralized solutions would be more advantageous. Lowering the temperature level (low-temperature network) can significantly reduce losses and thus create economically viable operating conditions even at lower connection densities.
Bringing the criteria together
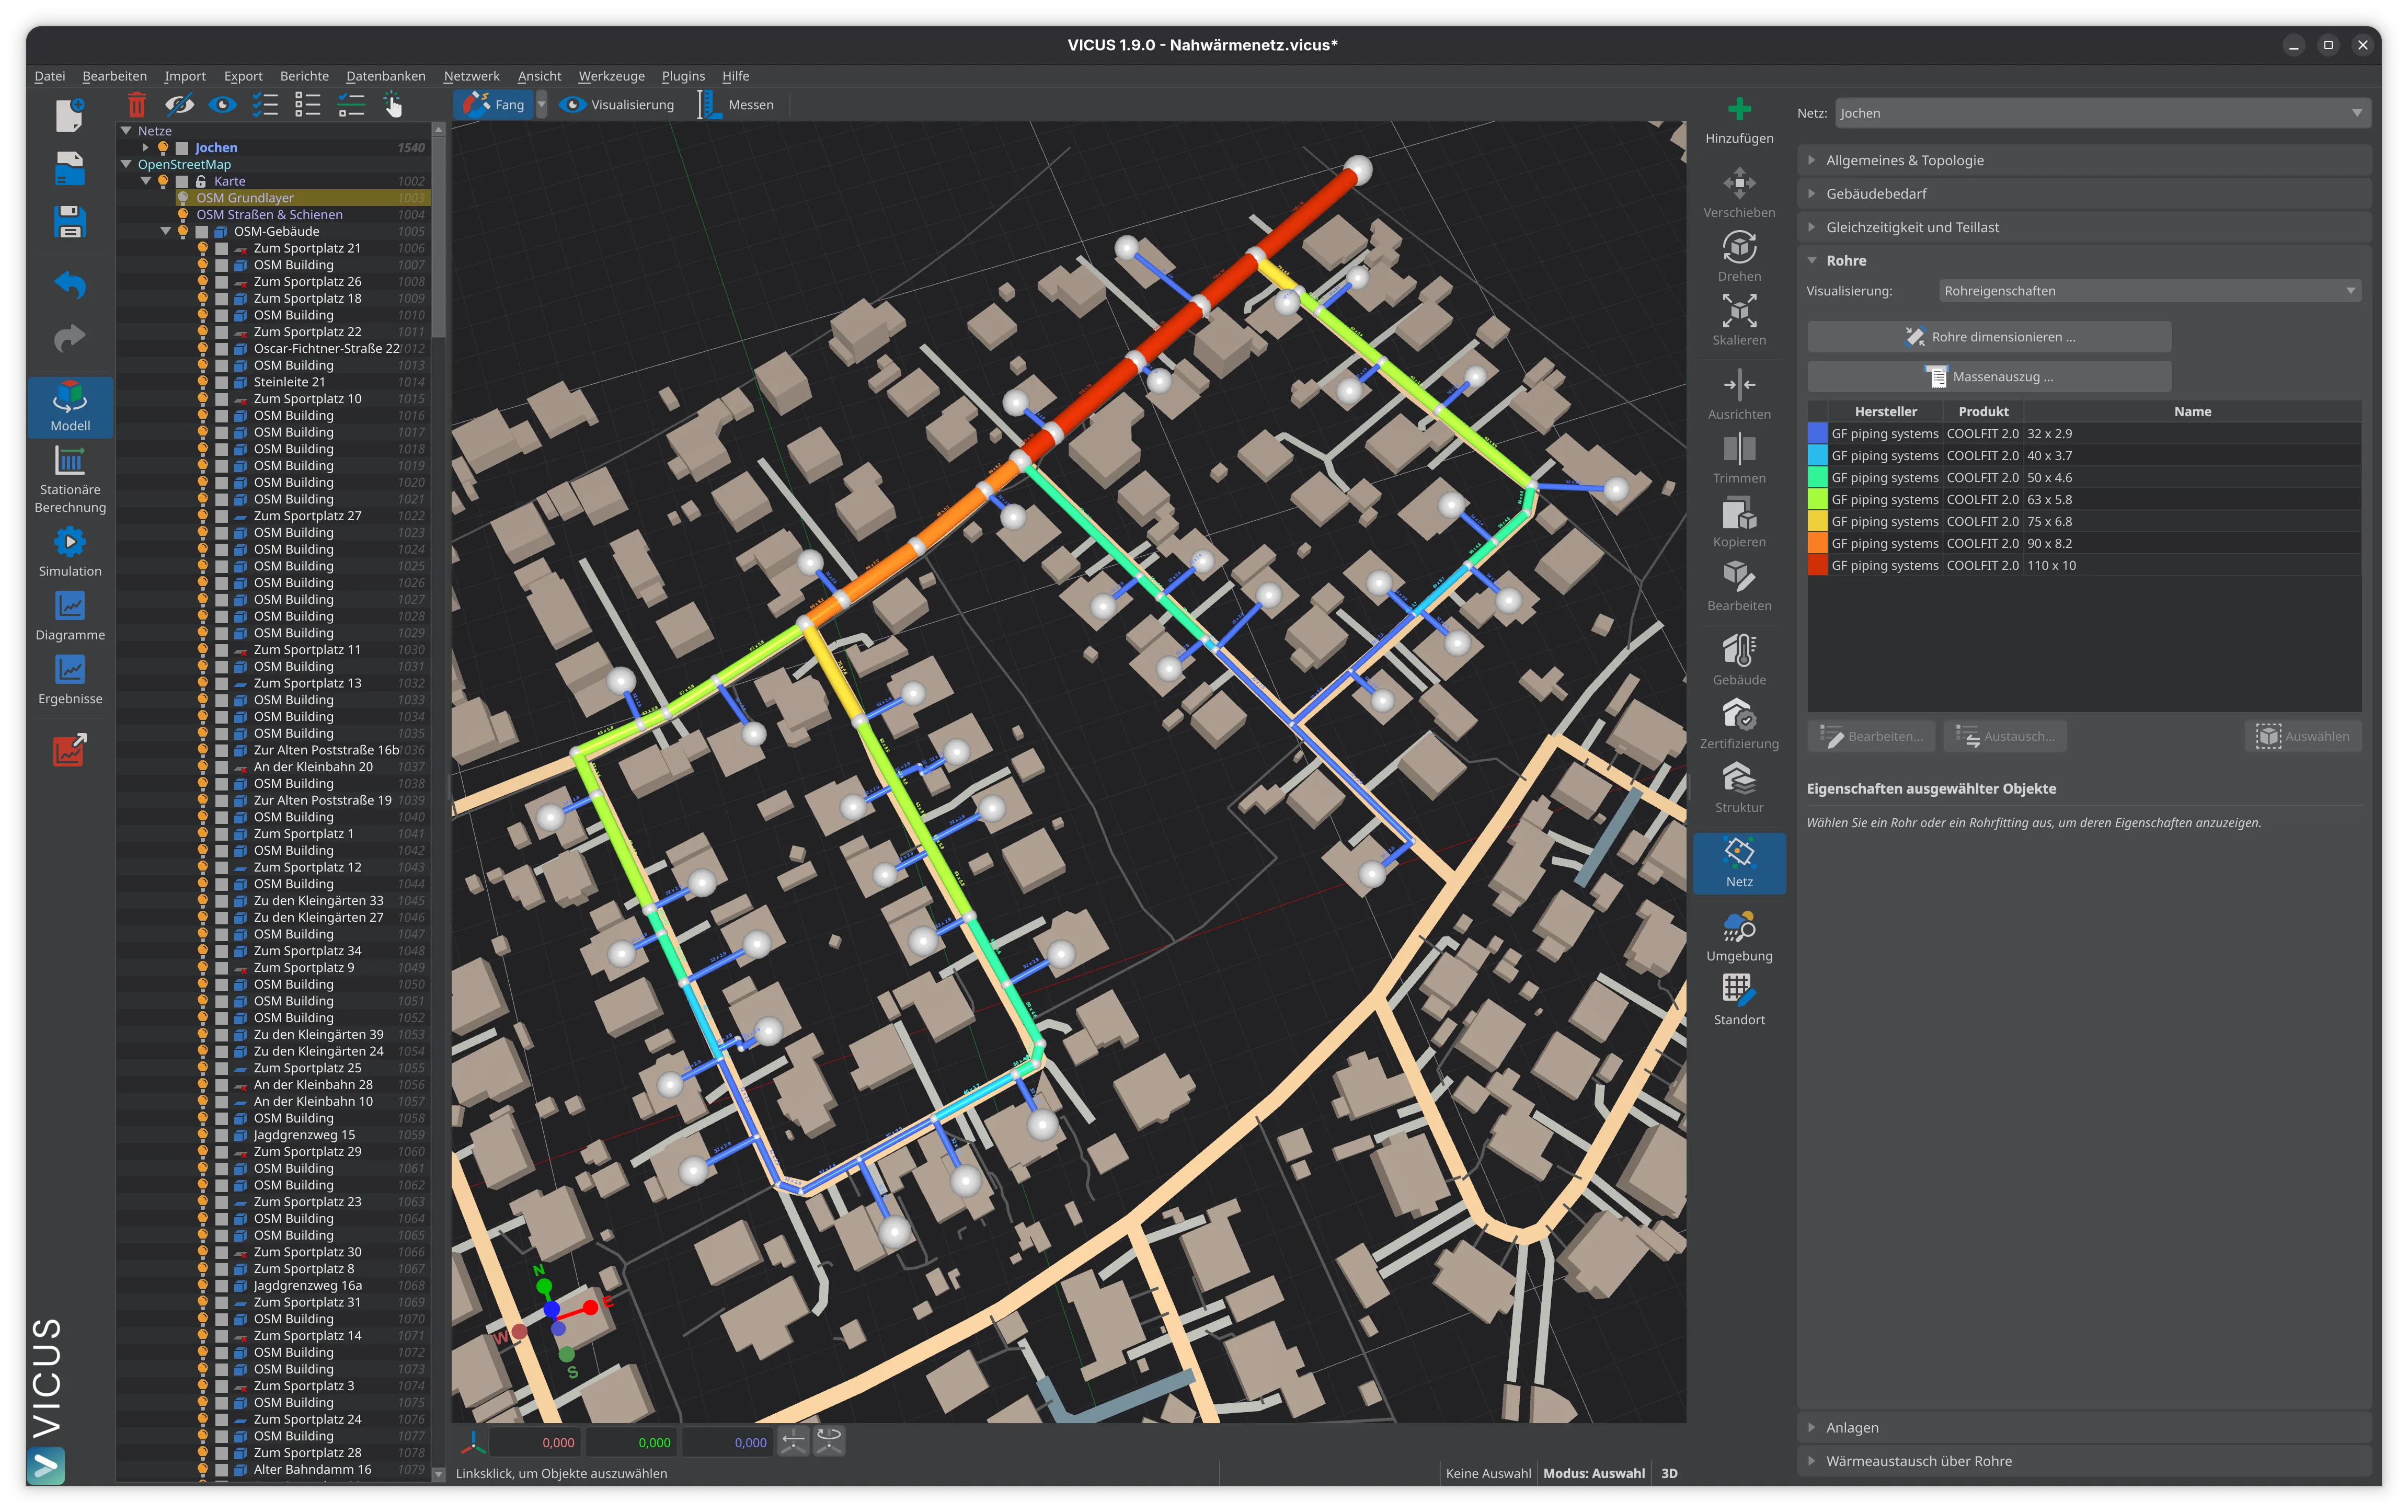
The supply area of a thermal network is delineated iteratively: key customers form the starting point, heat demand density evaluates the suitability of zones, and connection density provides the economic benchmark for the chosen route alignment. Both metrics, heat demand density and connection density, must be calculated and critically evaluated in every feasibility study. Software such as VICUS Districts supports this process by spatially presenting heat demands and making network variants comparable.
Further reading: Heat Line Density delves deeper into the economic evaluation of network routes based on linear heat density, Heat Load Demand and Load Profile describes the determination of the temporal demand profile as the basis for generation plant sizing, and Planning Phases of Thermal Networks provides an overview of the structured project workflow from the preliminary study to operation.
References and Standards
- BMWK (2024): Guideline for Municipal Heat Planning. German Federal Ministry for Economic Affairs and Climate Action.
- Nussbaumer, T.; Thalmann, S.; Zaugg, D.; Cueni, M. (2025): Planning Handbook for Thermal Networks. Version 2.0, EnergieSchweiz / Swiss Federal Office of Energy SFOE.
- AGFW Annual Report — District Heating in Germany, annually updated industry statistics by AGFW
Frequently Asked Questions
What heat demand density makes a district heating network viable?
What is connection density in district heating and what are the benchmarks?
Who are key customers in district heating network planning?
Related Articles
Planning phases of thermal networks: From the supply area through design to operation. The six steps of district heating network planning at a glance.
Disclaimer: The content of this page is for general information purposes only and does not constitute legal, planning or engineering advice. All information is provided without guarantee. Despite careful research, VICUS Software GmbH assumes no liability for the accuracy, completeness or timeliness of the information provided. Third-party product names and trademarks are mentioned for informational purposes only and are the property of their respective owners.