Create the network and size the pipes
District heating network, part 1: create a heat network and perform the pipe sizing
Overview ▶ 0:09

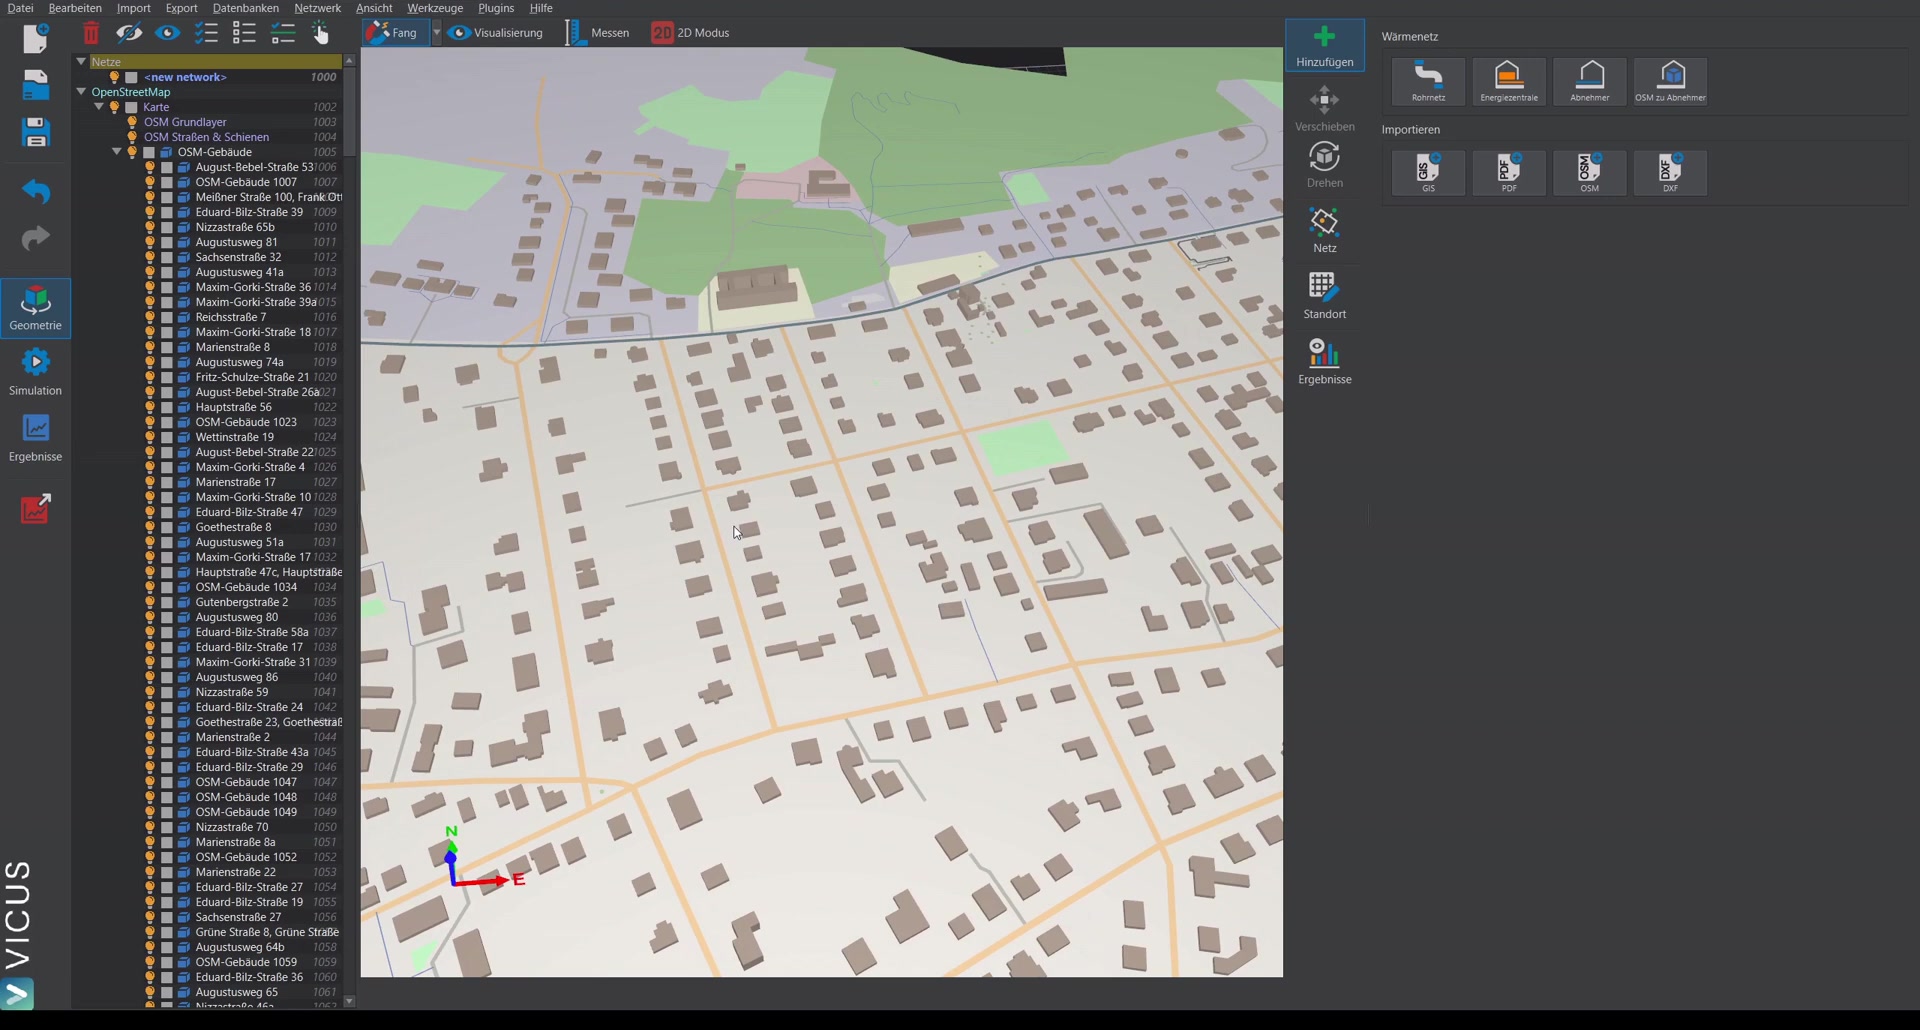
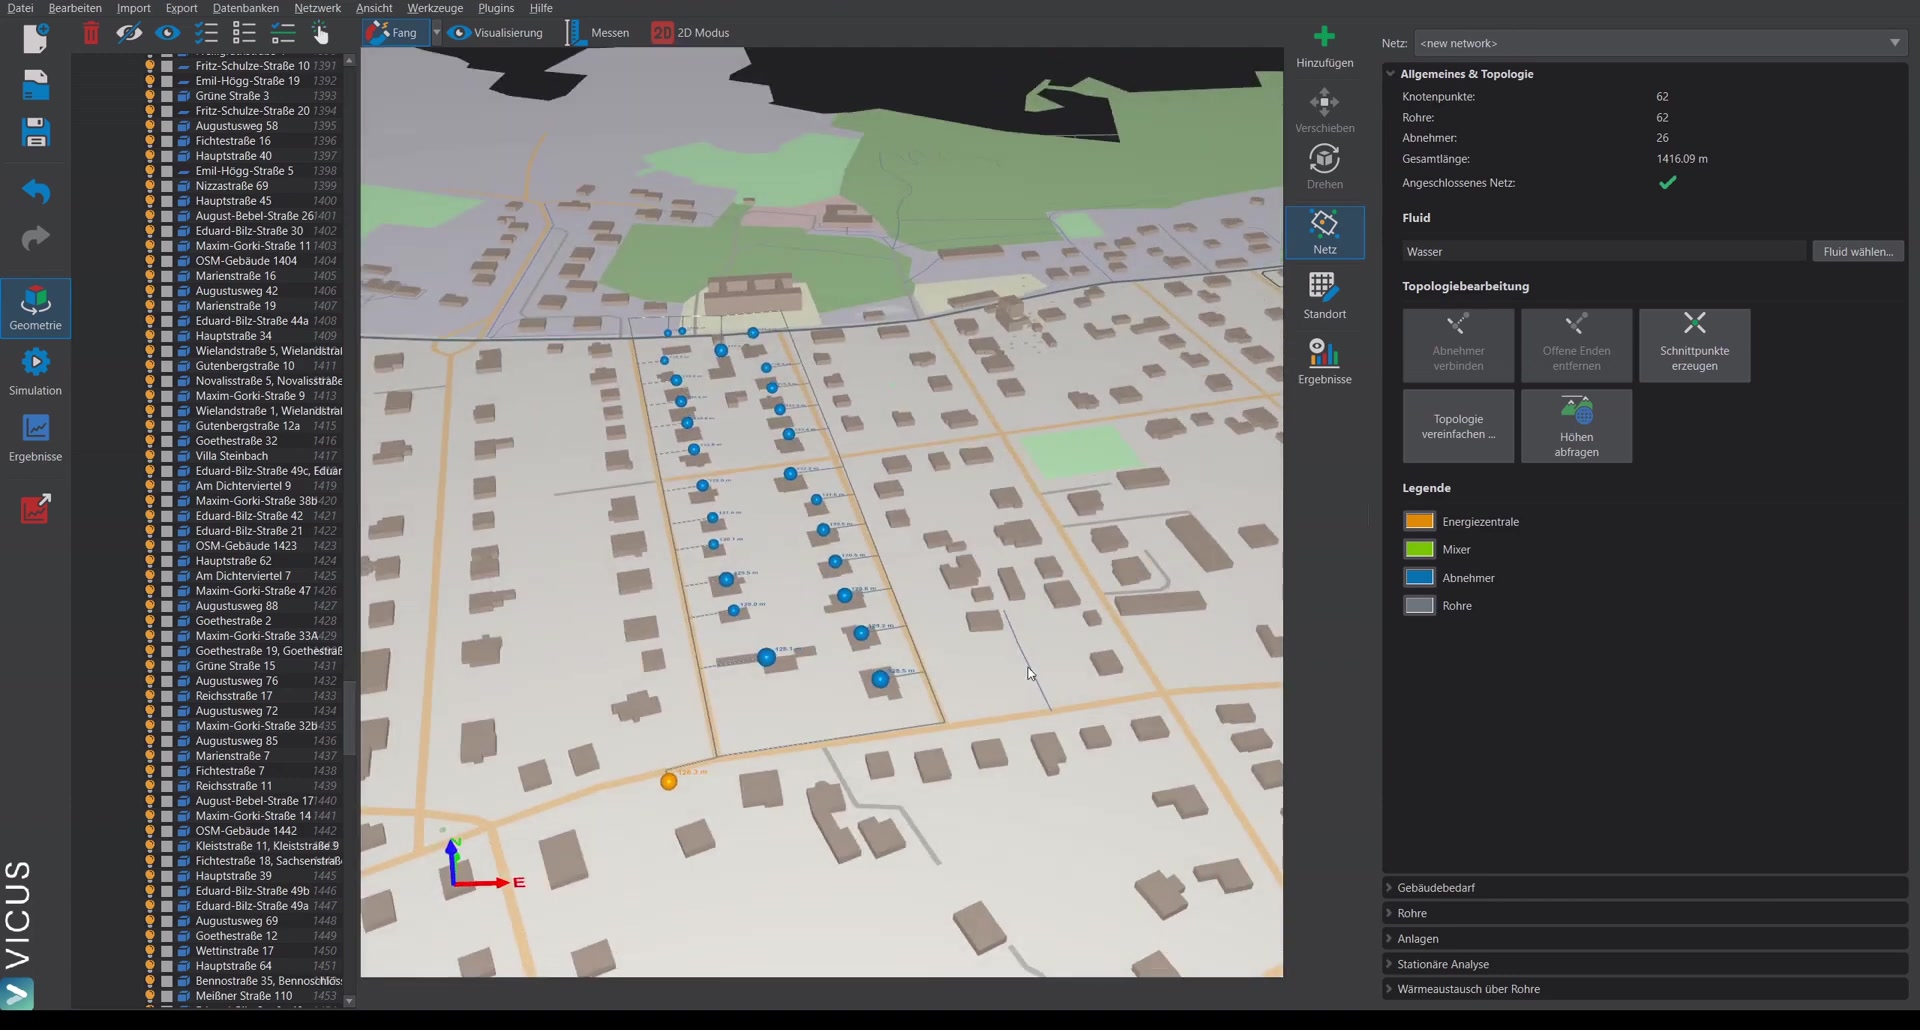
This tutorial demonstrates how to create a district heating network in VICUS Districts. In the first step, consumers are generated from OpenStreetMap data, a pipe network is drawn, the consumers and the energy plant are connected, and pipe sizing is performed.
As preparation, an OpenStreetMap section has already been imported into VICUS Districts. If this has not yet been done, it can be done via Import > OpenStreetMap by choosing a map section, which is then downloaded and displayed automatically.
Creating consumers ▶ 0:47
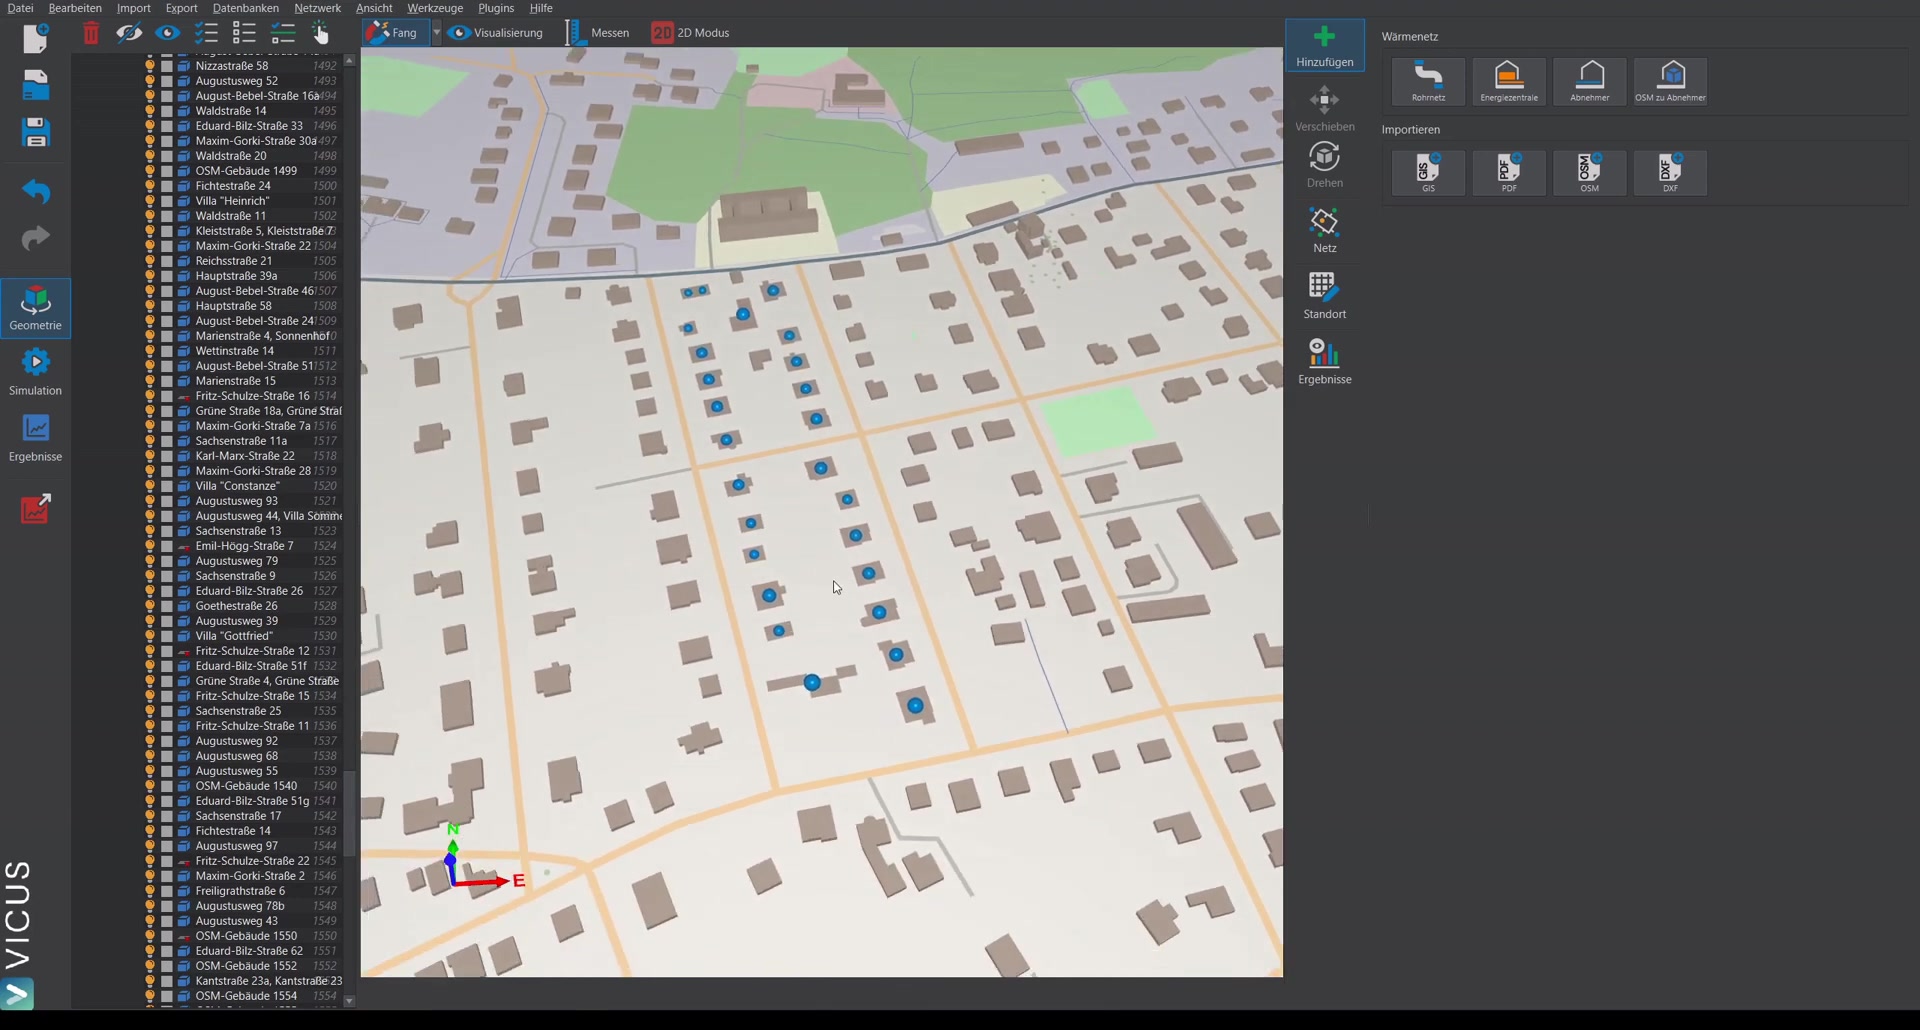
In the first step, the consumers to be connected to the network are determined:
- Select buildings directly on the map and switch to the OpenStreetMap to consumer mode.
- Holding down the Ctrl key, drag a selection window from top left to bottom right to select multiple buildings at once.
- Deselect small buildings if necessary. The addresses are displayed.
- Choose the building energy standard or leave the predefined settings.
- Click Next — gross and net floor area, connection load, and heating energy demand are displayed here.
- Click Create consumers to create the consumers. The consumers are displayed as points.
Drawing the heat network ▶ 2:01
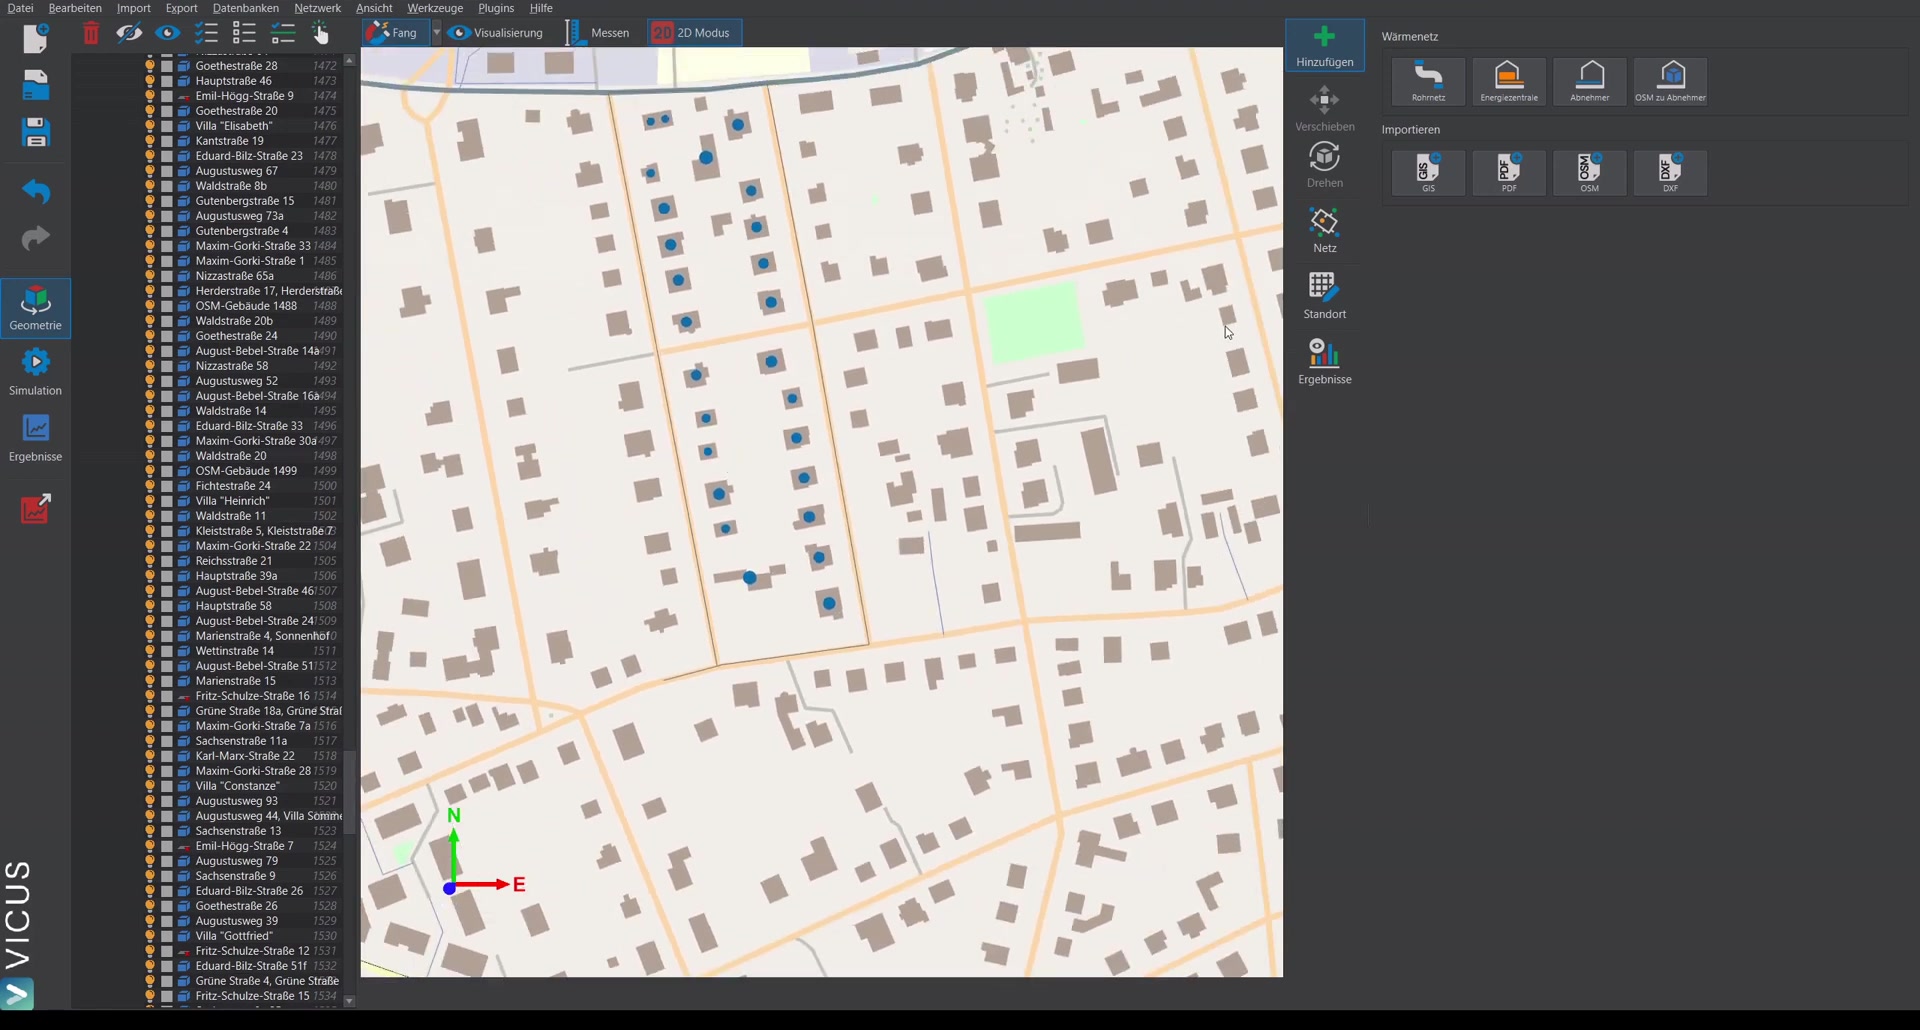
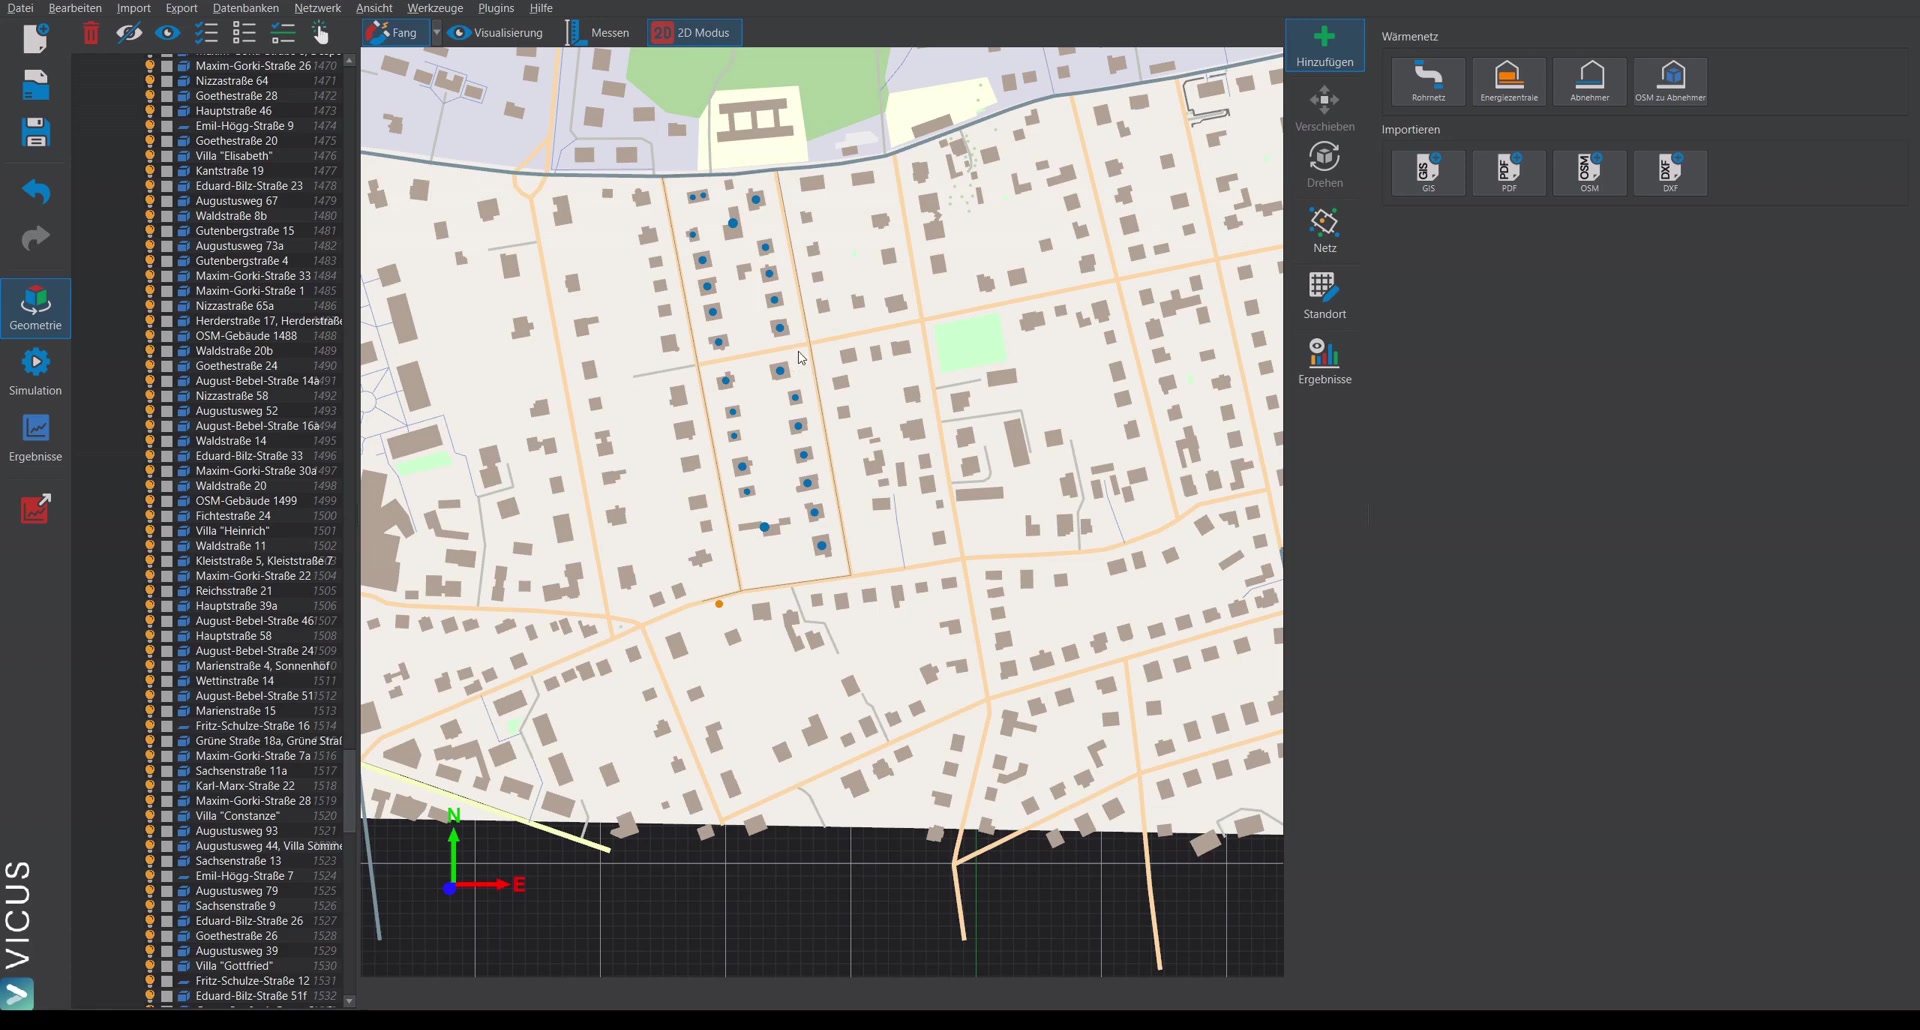
In the next step, the heat network is drawn. It is advisable to switch to 2D mode for this:
- Click on Pipe network and click along the street. Each left mouse click sets a new point in the network.
- Confirm the polyline with Enter and select Create pipe network.
Drawing the energy plant ▶ 2:45
- Click Create energy plant and place the energy plant at the desired position.
- Confirm with Enter and create the energy plant.
Connecting the network ▶ 3:03
After switching to network parameterization mode, various algorithms are available for topology editing:
- Connect all consumers — this also automatically connects the energy plant, and open ends are removed.
- Query elevations — the elevations are set automatically via a server interface. In 3D mode you can verify the correct three-dimensional positioning.
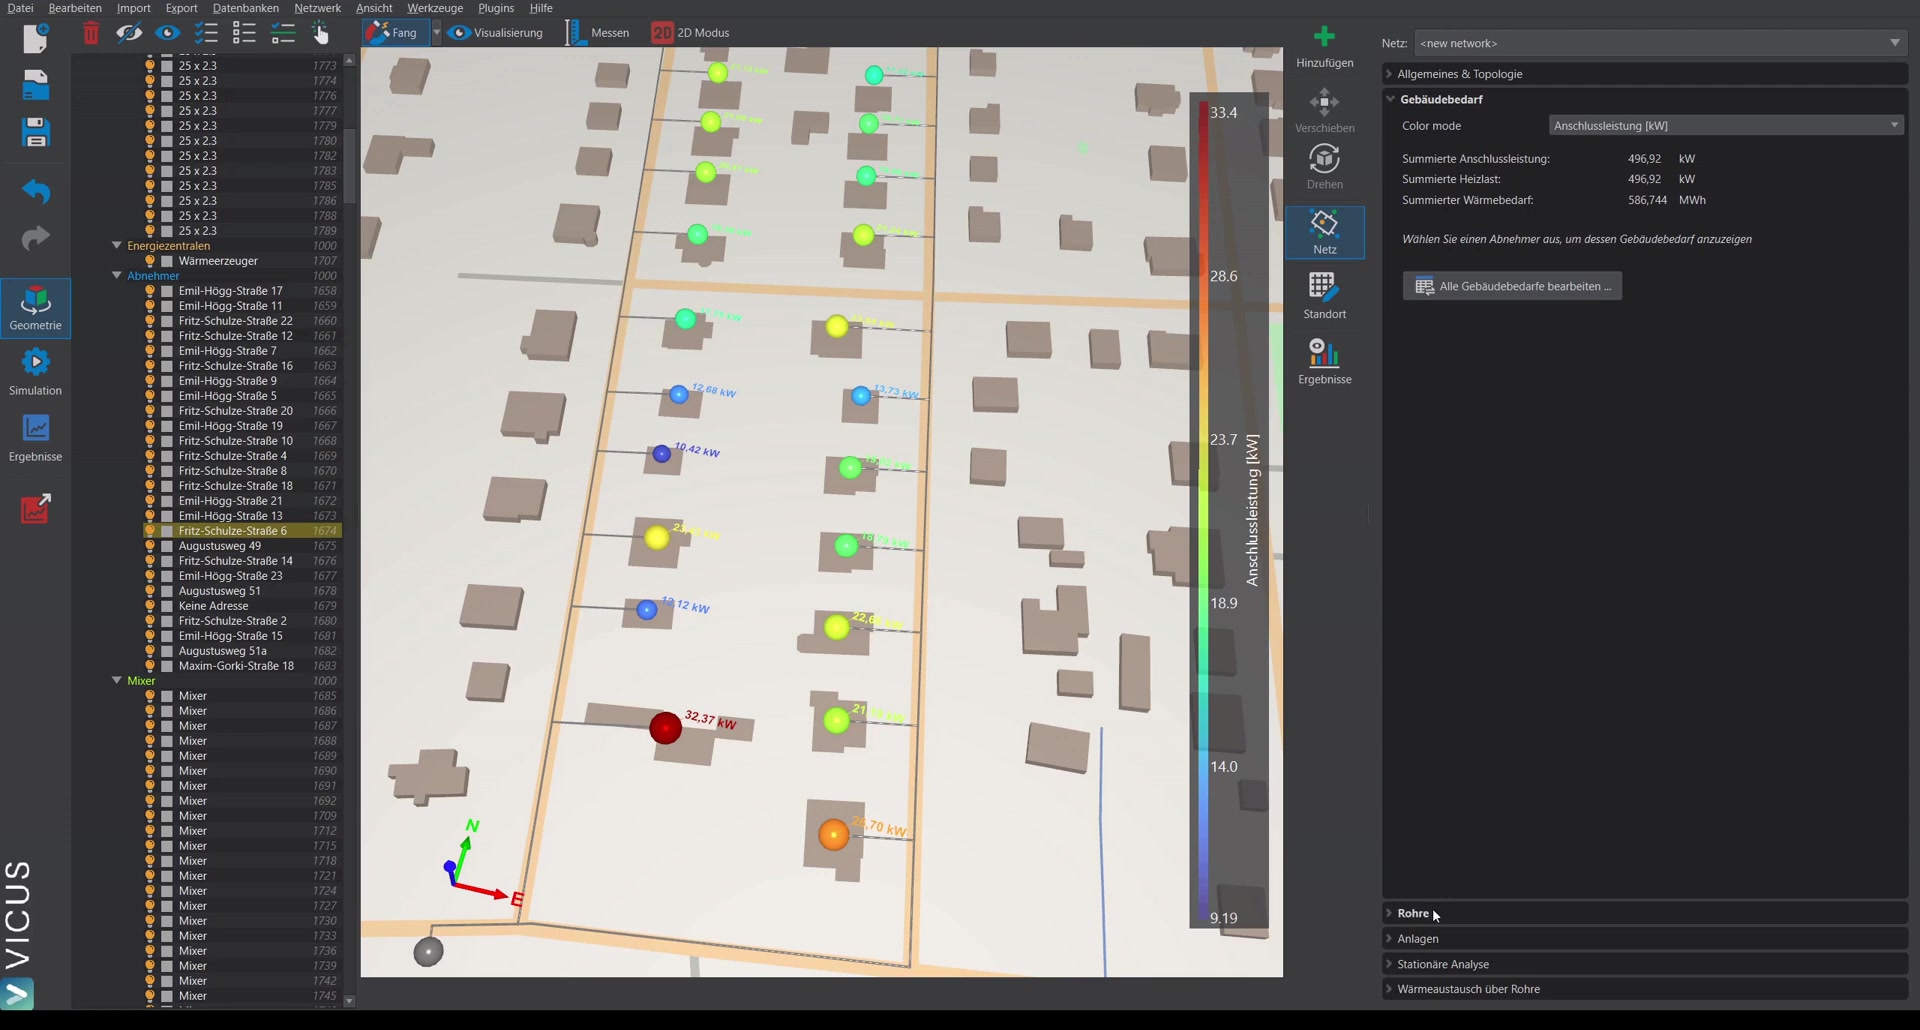
Building demand and connection loads ▶ 3:42
On the Building demand tab, the connection loads are displayed. When selecting a consumer, detailed information is shown, including heating load, heating energy demand, and the associated dynamic profile. Press Escape to deselect the consumer again.
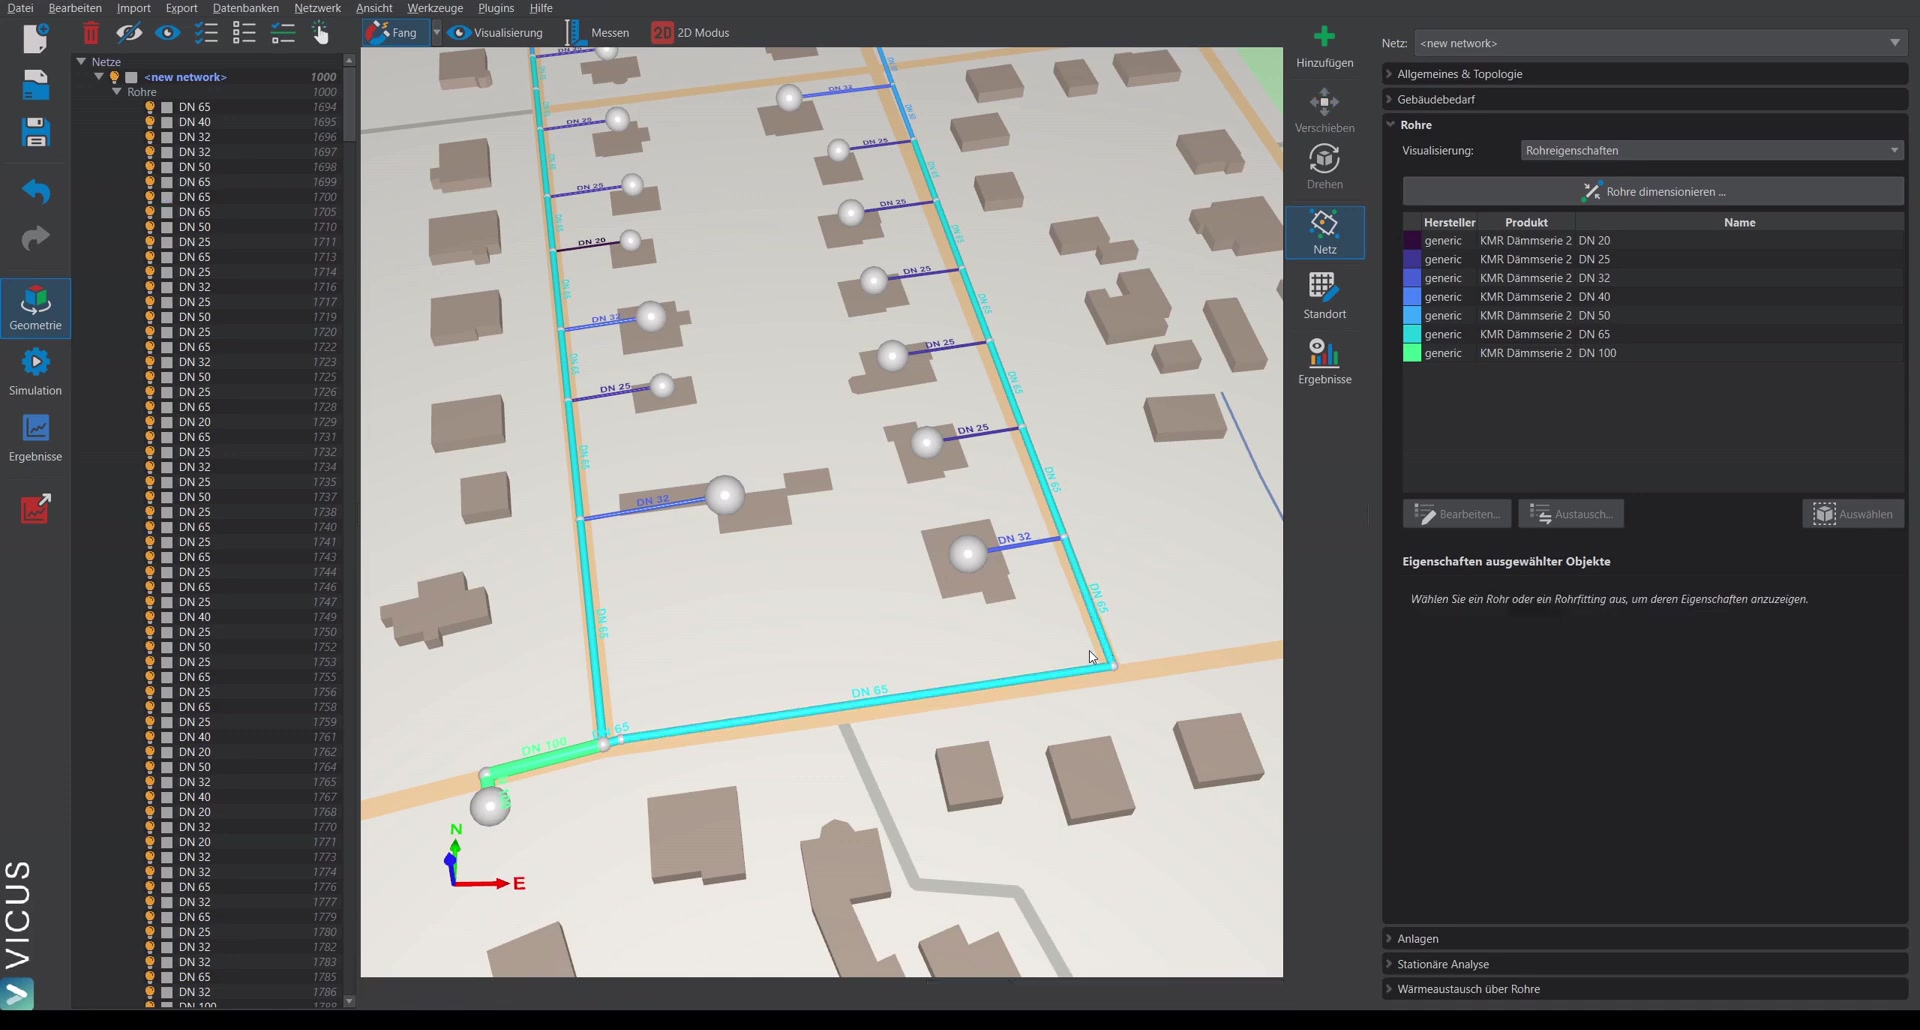
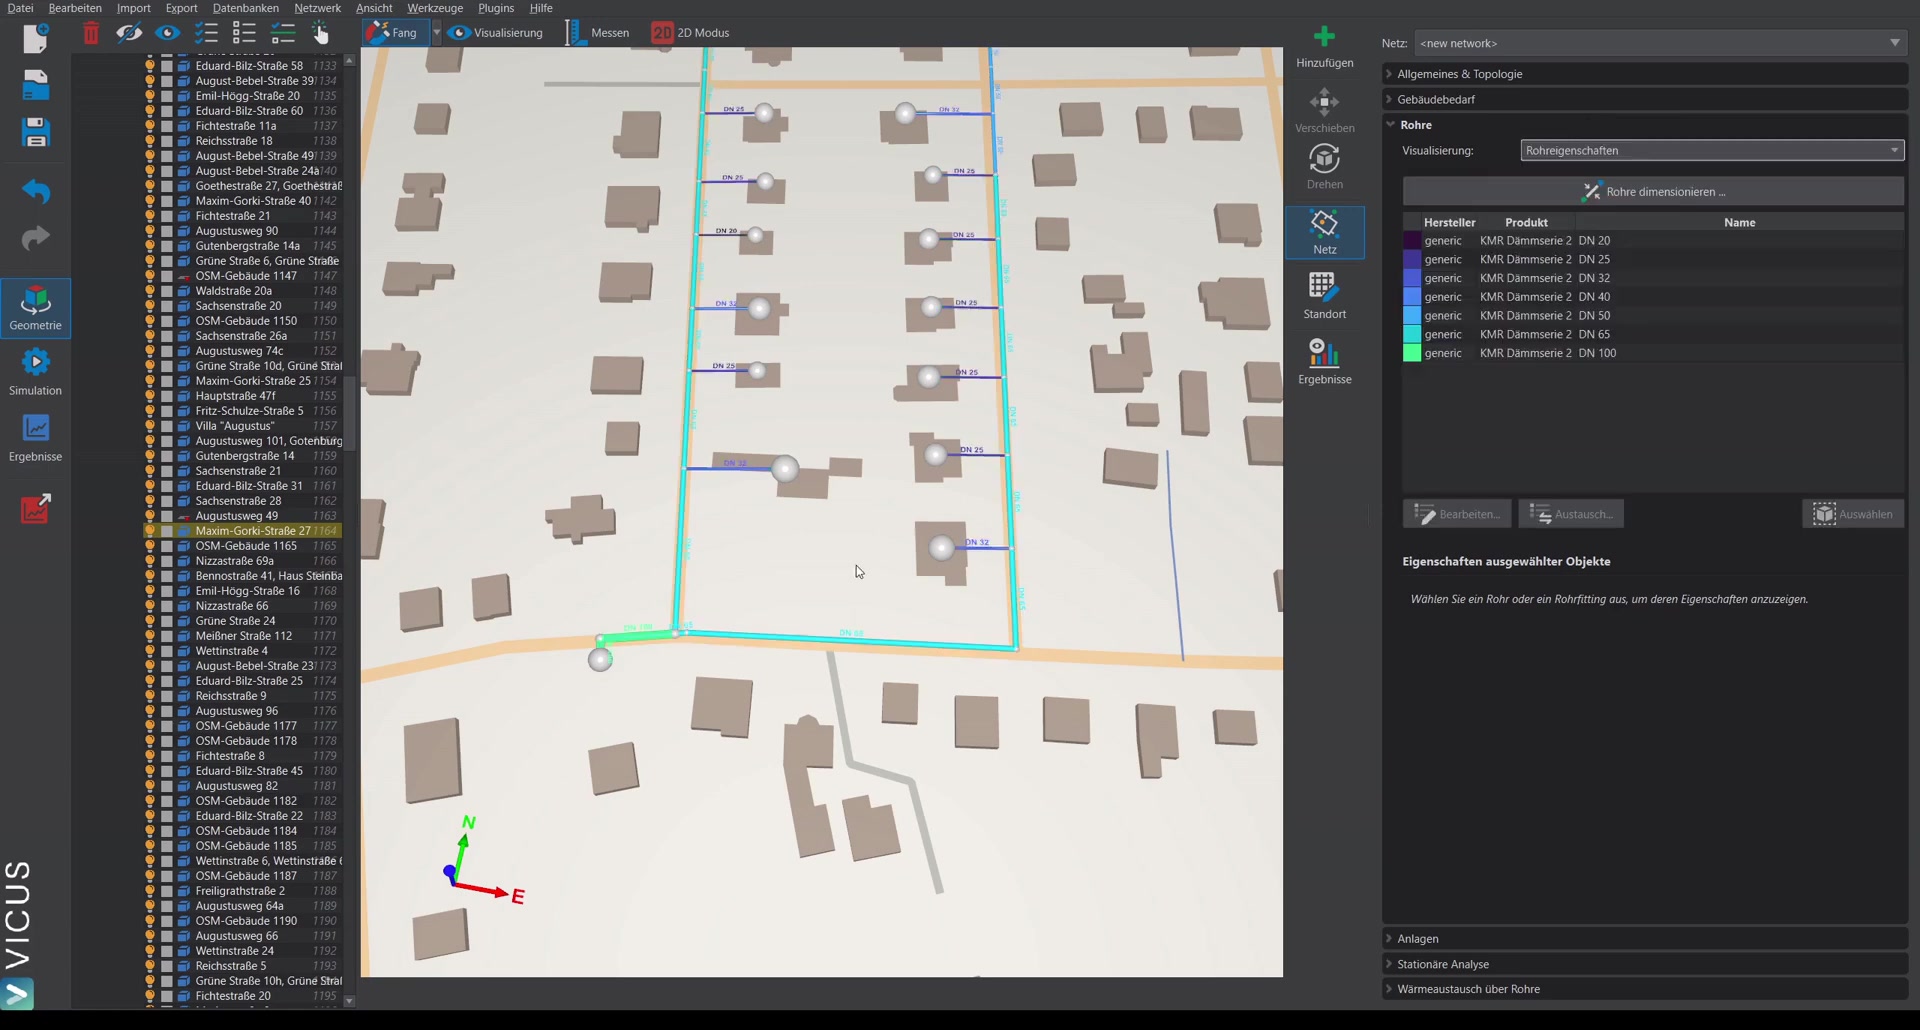
Performing the pipe sizing ▶ 4:10
The pipe network sizing is performed in pipe mode:
- Click Size pipes.
- Set supply temperature and temperature spread (e.g. 20 Kelvin).
- Make a pre-selection of pipes from the database — use the checkboxes on the left to select the desired pipes.
- Optionally, apply the simultaneity function and edit a specific function.
- Configure additional settings for the pipe fittings.
- Perform pipe sizing — e.g. with a maximum pressure loss of 100 pascal per meter and the selected spread.
Editing pipes manually ▶ 5:14
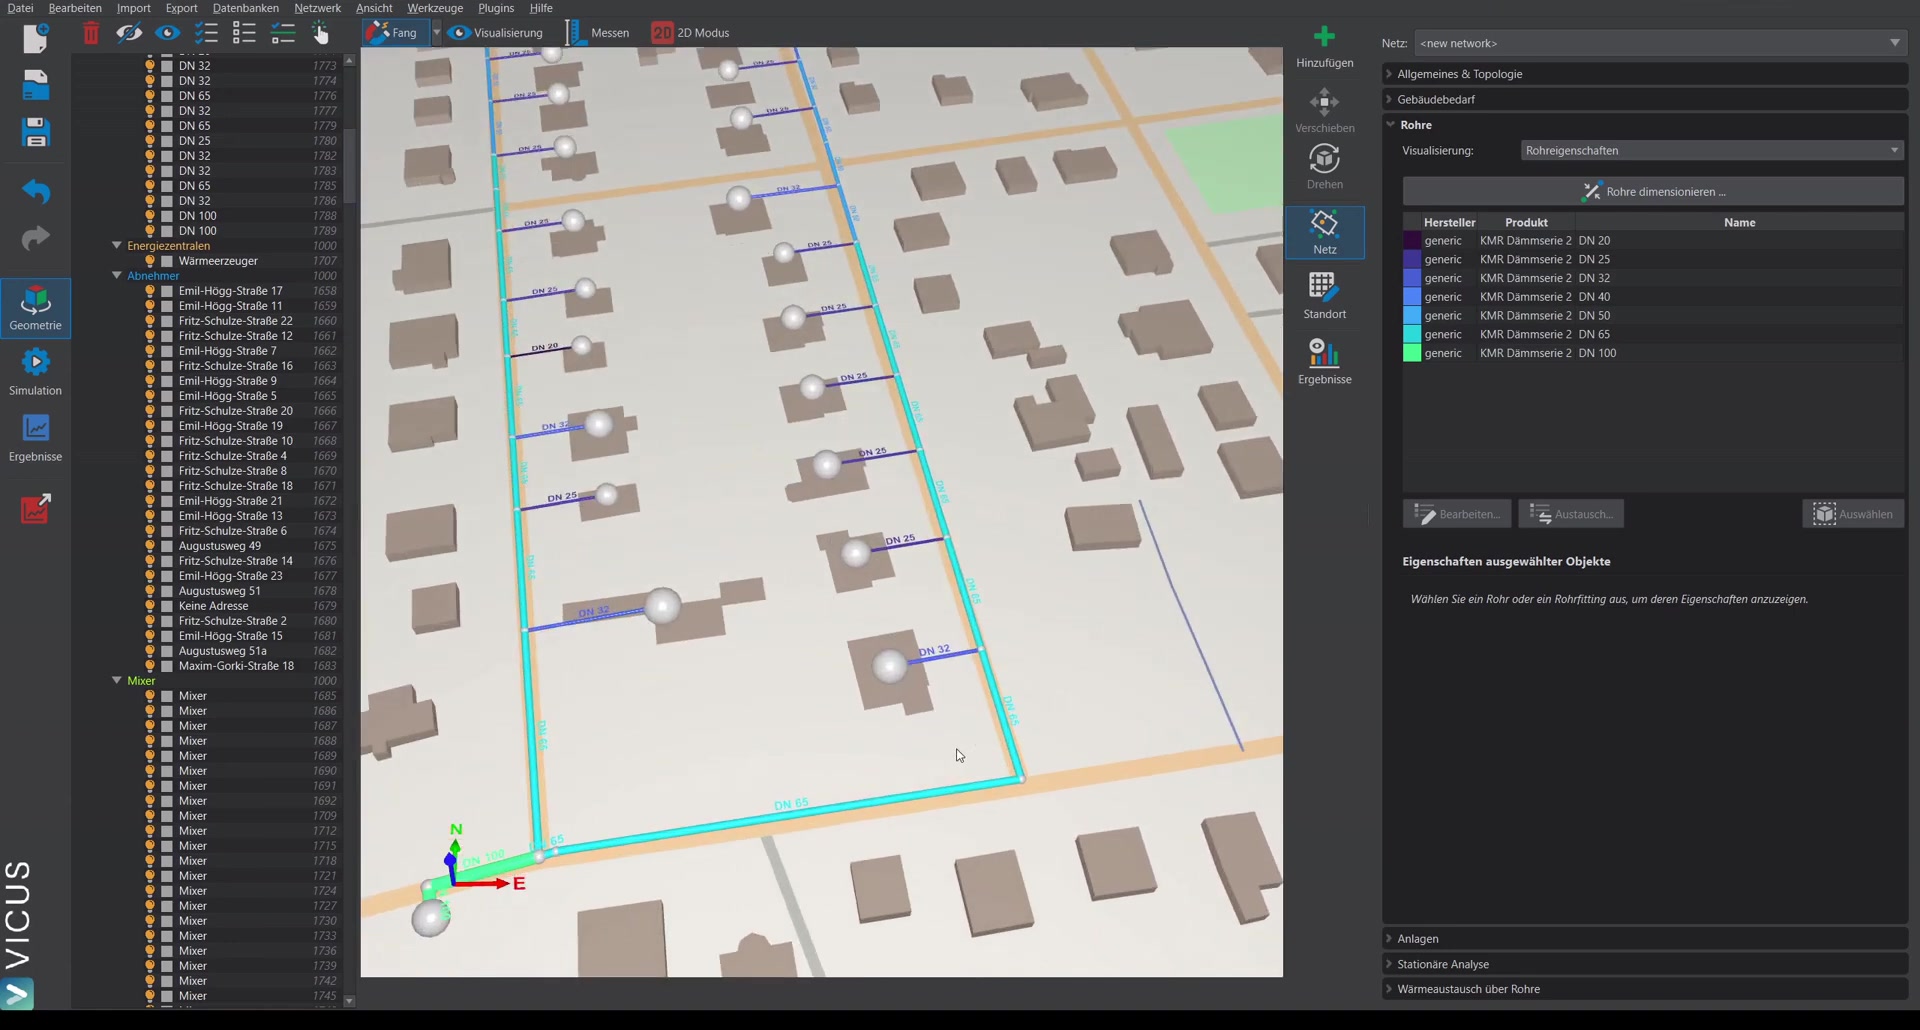
The automatic sizing can also be adjusted manually. Select a route section and assign a different pipe from the database. This also works for multiple pipes at once.
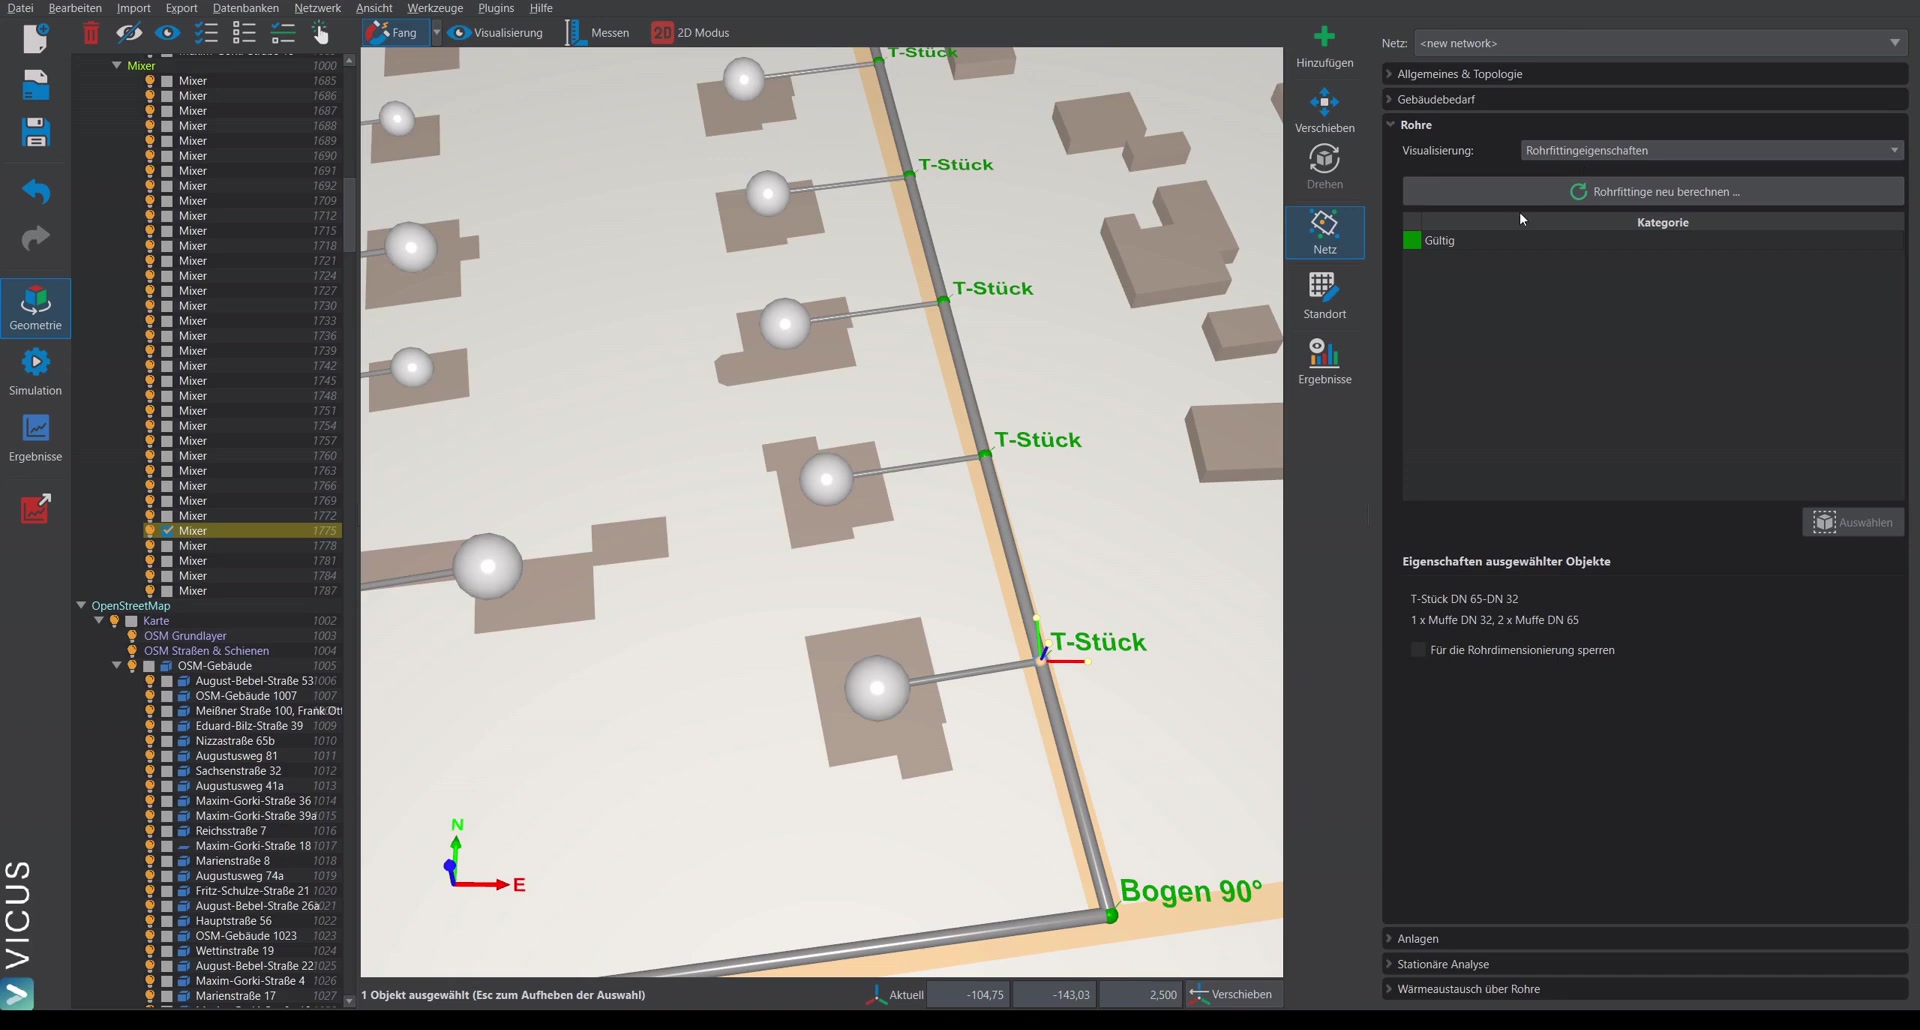
Displaying pipe fittings ▶ 5:36
In Pipe fitting properties mode, the calculated fittings are displayed — bends and tees are visualized accordingly. Clicking on a node shows detailed information on the associated fittings.
Locking the sizing ▶ 6:04
Sections of the network can be locked from sizing — for example, in an existing network:
- Select part of the network with the Ctrl key.
- Tick the Lock sizing checkbox.
- Under Locked objects, it is visualized which sections have a fixed sizing.
Bill of materials ▶ 6:42
Under Results > Bill of materials, a summary of all pipes in the network is shown, grouped by dimension, as well as all fittings — grouped by dimension and type. Alternatively, an individual display can be activated that lists each individual route section or node in the network.