Heat Load Demand and Load Profile
How is the heat load demand of a thermal network determined? Load curves, annual load duration curves and full-load hours
Table of Contents
Heat load demand determines the design of every component in a district heating network — from the heat generators and pipe dimensioning to the overall economic viability. It comprises space heating (8—30 W/m² depending on building type), domestic hot water, and distribution losses, and is analyzed using the annual load duration curve, which divides demand into base load and peak load. The simultaneity factor (0.50—0.80 depending on customer count) significantly reduces the actual peak demand compared to the sum of individual connections.

Components of Heat Load Demand
The total heat demand of a thermal network is composed of several components:
- Space heating: weather-dependent, with strong seasonal fluctuations, typically only during the heating season (approx. 250 days/year)
- Domestic hot water: required year-round, relatively constant with slight seasonal variations
- Process heat: depending on the consumer structure (industry, commercial) with its own load profile
- Heat distribution losses: year-round, depending on network temperatures and insulation
Specific Heat Demand by Building Type
The specific heating demand varies considerably depending on building standard and year of construction:
| Building Type | Specific Heat Load Demand |
|---|---|
| Conventionally insulated residential buildings | 20 — 27 W/m² |
| Well-insulated residential buildings | 15 — 20 W/m² |
| New buildings to current standards | 8 — 15 W/m² |
| Conventional commercial buildings | 23 — 30 W/m² |
| Workshops and production facilities | 10 — 20 W/m² |
These values refer to the energy reference area (ERA) and serve as an initial estimate. For existing buildings, an estimate based on actual energy consumption is preferable.
Load Curve and Annual Load Duration Curve
Load Curve
The load curve represents the relationship between the heat load demand of the network and the outdoor temperature. It is composed of the power requirements of all connected customers as a function of outdoor temperature:
- At design temperature (e.g., °C in Zurich): maximum heat load demand
- At heating limit (e.g., °C): only domestic hot water and heat losses
- Above the heating limit: reduced summer operation
Annual Load Duration Curve
The annual load duration curve is one of the most important planning tools. It arranges the hourly power values of a year in descending order and shows how many hours per year a certain output level is exceeded.
Typical characteristics of an annual load duration curve for thermal networks:
- Peak load demand occurs for only a few hundred hours per year
- Around 50% of the annual heat demand is required in only 100 to 120 days
- Summer operation (domestic hot water, losses) accounts for approx. 15 — 25% of peak demand
The annual load duration curve forms the basis for dividing demand into base load and peak load, which directly determines the selection and dimensioning of the heat generators.
Full-Load Hours
Full-load hours describe the equivalent time during which a generator would need to operate at rated capacity to cover the annual energy demand:
where is the annual heat energy [kWh/a] and is the maximum heat output [kW].
Typical full-load hours for various building types and regions:
| Building Type / Region | Full-Load Hours |
|---|---|
| Residential building, existing, lowland | 2,000 — 2,500 h/a |
| Residential building, new, lowland | 1,300 — 1,700 h/a |
| Residential building, existing, mountain region | 2,300 — 2,800 h/a |
| Residential building, new, mountain region | 1,600 — 2,300 h/a |
Full-load hours are an important indicator of network utilization and thus of economic viability.
Simultaneity Factor
Not all customers demand their maximum output at the same time. The simultaneity factor describes the ratio between the maximum simultaneously occurring demand and the sum of all subscribed connection capacities:
The simultaneity factor decreases with an increasing number of heat customers. For residential buildings, typical values are:
- 5 customers:
- 20 customers:
- 100 customers:
- 300 customers:
The simultaneity factor has a direct impact on the dimensioning of heat generators and main pipelines. It is generally not applied to the building service connections, as these must cover the individual demand of each customer.
Assessment in Practice
A proven iterative approach for determining heat load demand is:
- Determine the energy reference area (ERA) of the buildings
- Estimate the specific heating demand based on building standard and type of use
- Add the domestic hot water demand (for residential buildings approx. 20 kWh/(m²·a))
- Model the load profile based on climate data and usage profiles
- Derive the annual load duration curve from the hourly values
- Apply the simultaneity factor and determine the total load demand
For existing buildings, energy consumption can be validated through heating cost invoices and meter reading evaluations. For new buildings, attention must be paid to declining consumption due to building refurbishments over the network’s operating lifetime.
Significance for Network Planning
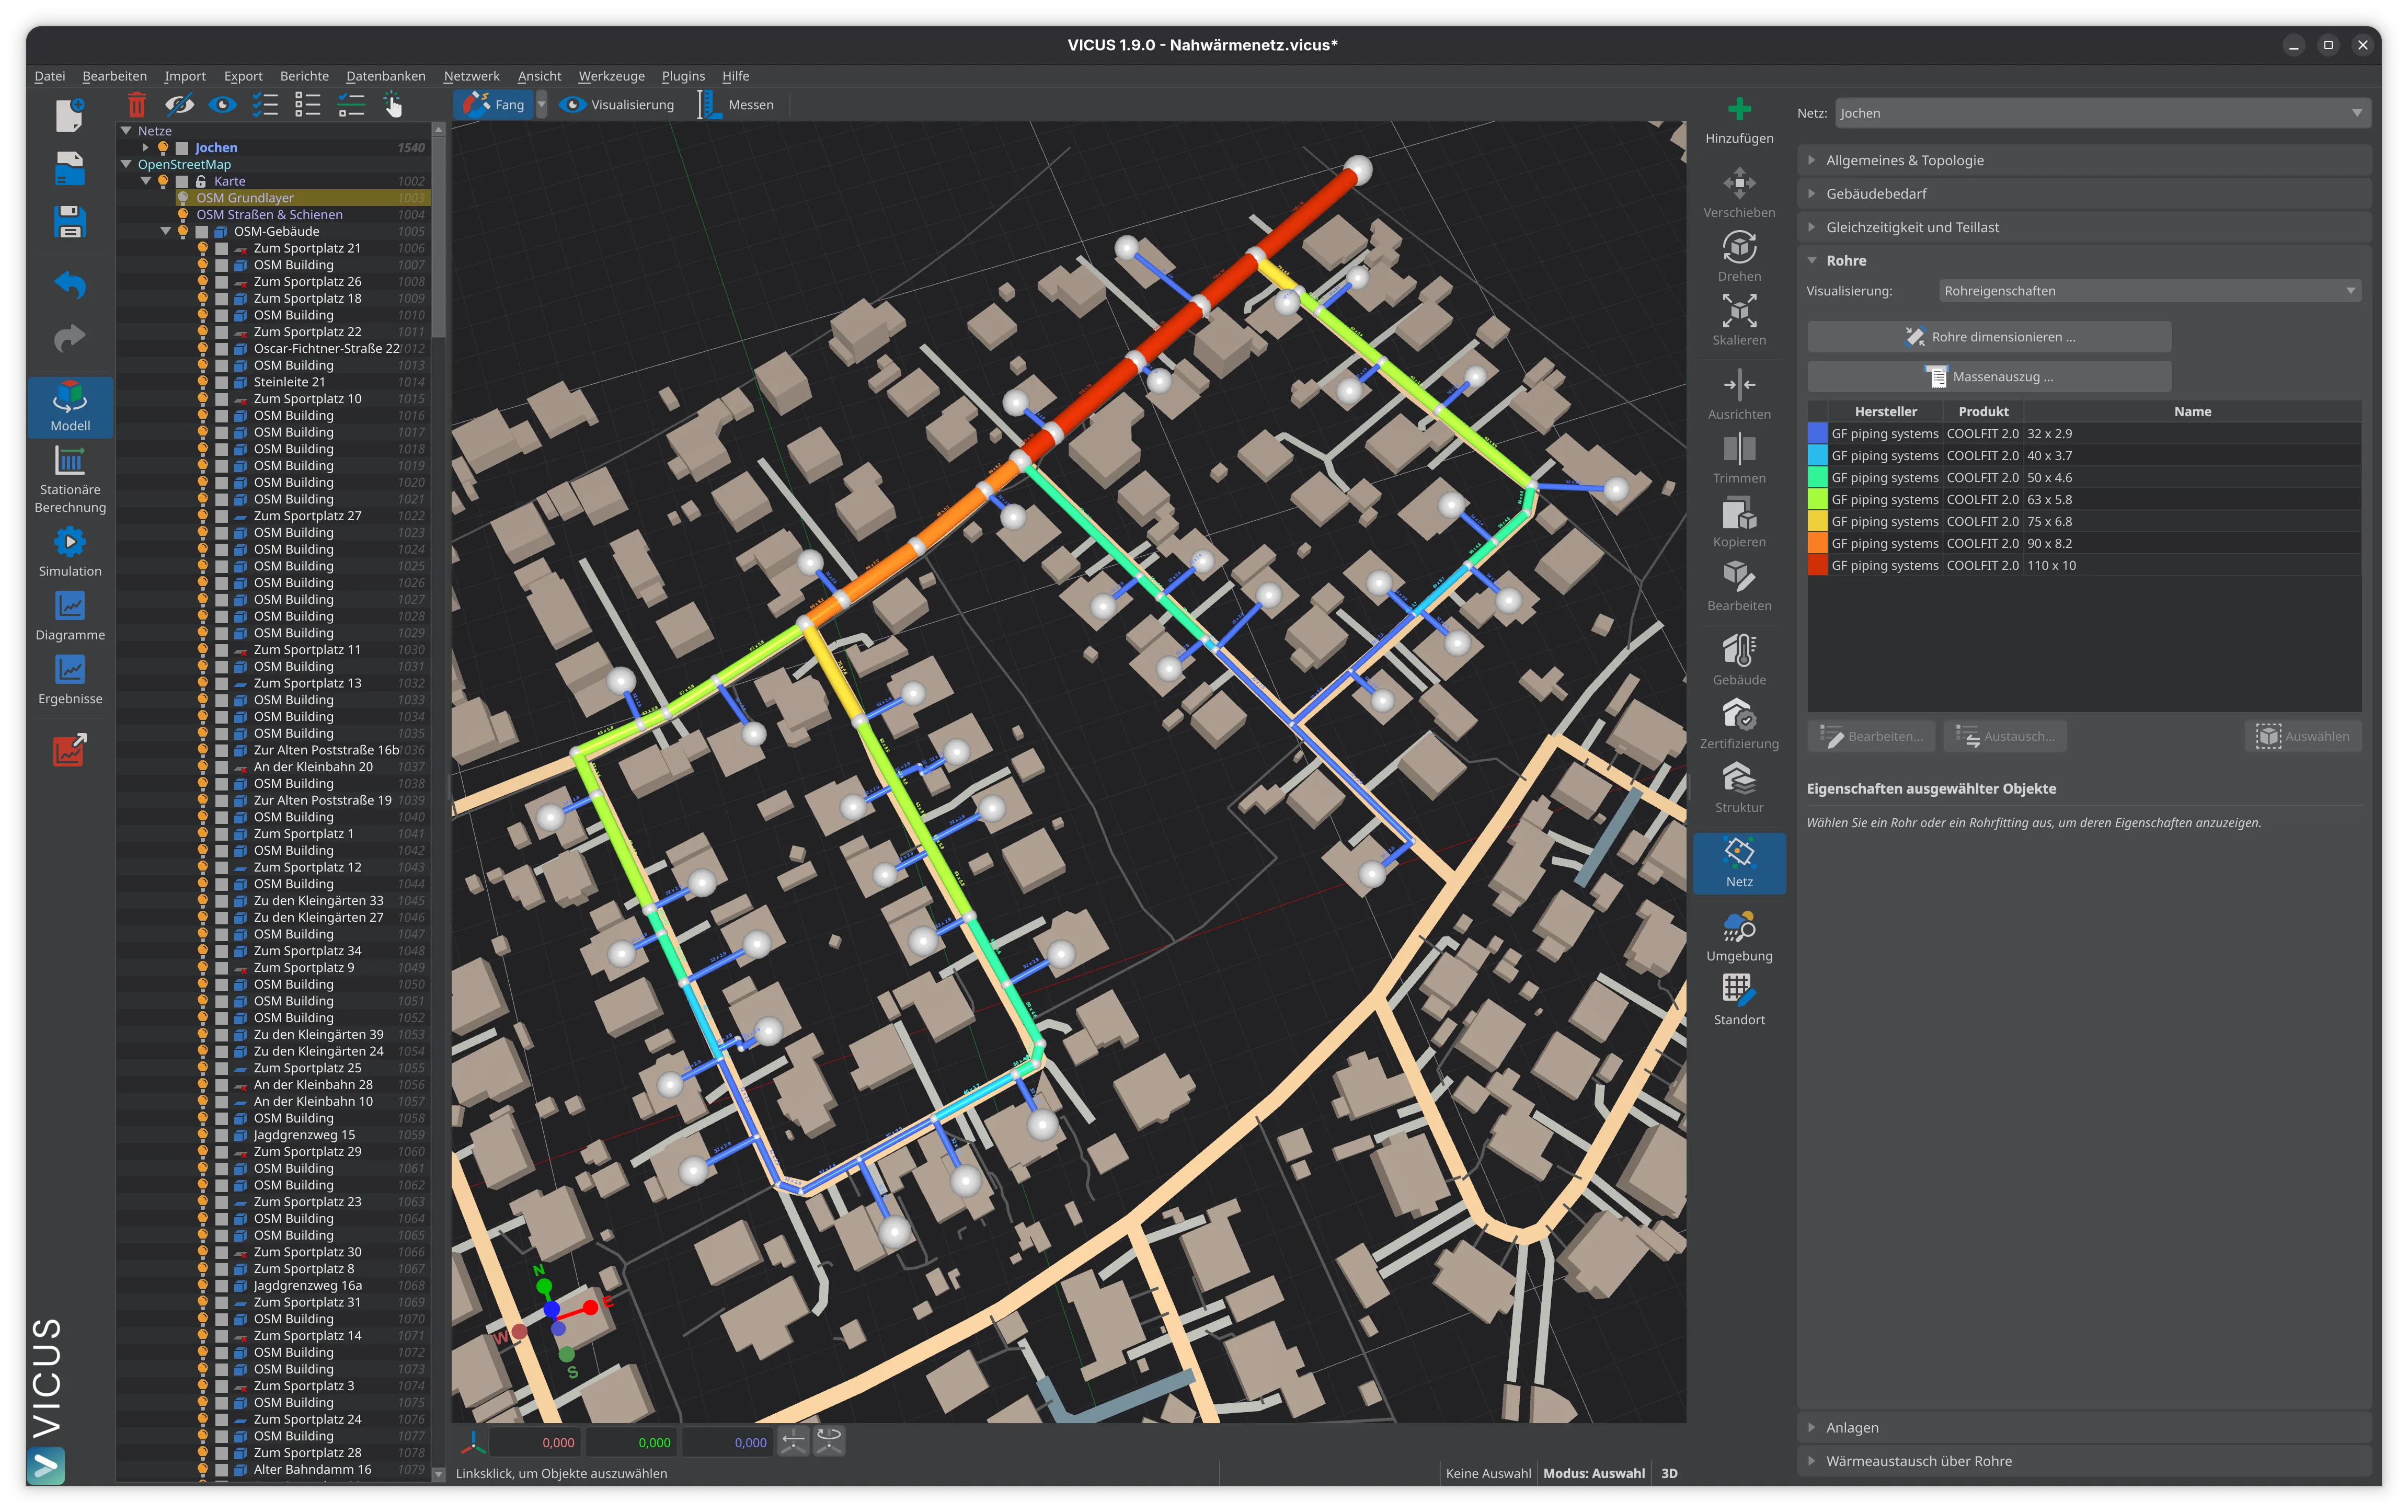
The careful assessment of heat load demand forms the foundation for all subsequent planning steps. An overestimated demand leads to oversized and thus uneconomical systems. An underestimated demand can cause supply bottlenecks. Simulation software such as VICUS Districts enables detailed modeling of load profiles and their interaction with generation and the distribution network.
Further reading: Pipe Dimensioning shows how the determined heat load demand feeds into the determination of pipe diameters, Supply Area and Heat Demand Density describes the spatial analysis of heat demand as the basis for network planning, and Economic Assessment According to VDI 2067 explains how the load profile enters the economic evaluation.
References and Standards
- DIN EN 12831 — Energy Performance of Buildings — Method for Calculation of the Design Heat Load
- VDI 4655 — Reference Load Profiles of Residential Buildings for Electricity, Heating and Domestic Hot Water
- AGFW FW 309 — Energy Performance Assessment of District Heating and District Cooling
Frequently Asked Questions
How is the heat load demand of a district heating network determined?
What is an annual load duration curve and what is it used for?
What is the simultaneity factor in district heating networks?
Related Articles
Overview of heat generation technologies: Wood boilers, heat pumps, solar thermal, geothermal, waste heat and CHP in comparison
Thermal energy storage for district heating networks: Sensible, latent and thermochemical storage technologies compared. Design and application areas.
Definition and assessment of efficiency ratings in thermal networks: Instantaneous and annual utilization efficiency, weighted assessment of heat and electricity
Disclaimer: The content of this page is for general information purposes only and does not constitute legal, planning or engineering advice. All information is provided without guarantee. Despite careful research, VICUS Software GmbH assumes no liability for the accuracy, completeness or timeliness of the information provided. Third-party product names and trademarks are mentioned for informational purposes only and are the property of their respective owners.